Climate Change & the Built Environment: Understanding the Scope of Embodied and Operational Carbon
“Our house is on fire.”
Greta Thunberg, an environmental and social justice activist, said those words to the World Economic Forum on January 25, 2019. She spoke with an urgency befitting a global emergency, pushing the politicians, billionaires, and thought leaders in attendance to meet the terms of the Paris Agreement, which established a global commitment to limit global warming t to well below 2°C above pre-industrial levels while pursuing efforts to limit it to 1.5°C. It was signed on April 22, 2016, and ratified by 196 countries.

Our house is on fire. Solving the climate crisis is the greatest and most complex challenge that Homo sapiens have ever faced. The main solution, however, is so simple that even a small child can understand it. We have to stop our emissions of greenhouse gases. Either we do that or we don’t.
GRETA THUNBERG ADDRESS TO WORLD ECONOMIC FORUM, JAN 25 2019

But a decade later, nations are lagging behind the goals of the treaty, the United States has withdrawn from it[1], and rapidly warming global temperatures are intensifying extreme weather events, notably in the recent tragic glacier collapse in Nepal and the heat domes over Europe and North America.
The 2025 United Nations Emissions Gap report—titled Off Target—states: “On the tenth anniversary of the Paris Agreement, the message is clear: only decisive, accelerated GHG emission reductions can align the world with the goals of the Paris Agreement and limit the escalation of climate risks and damages that, already today, are severe, and hit the poorest and most vulnerable the hardest.”
The task of addressing climate change grows more urgent by the day, and the Innovation Glass team is committed to doing our part in meeting the goals of the Paris Agreement.
DOING OUR PART
The first step is to understand the scope of the problem. There are four main types of gas that, when emitted as part of human activity, have the effect of retaining heat in the atmosphere—hence the term “greenhouse gas”. These gases vary in atmospheric lifespan and warming potency, and their emission must be curbed in the coming decades to prevent a spiral of rapid global warming and extreme weather events.
Carbon dioxide is, by far, the largest of the four major greenhouse gases at 74.5% of global emissions, measured in CO₂ equivalent. The built environment—the construction and operation of buildings—is responsible for a combined 42% of global carbon dioxide emissions.
Figure 1 ○ Sources and Methodology ↓
Key FIGURES
THE BUILT ENVIRONMENT
IS RESPONSIBLE FOR
42%
OF GLOBAL CO2 EMISSIONS
The above chart depicts the scale and complexity of the global problem, and illustrates what we can do in the built environment and the curtain wall industry to contribute to the solution.
Several key figures stand out.
First, that the built environment is responsible for 42% of global carbon dioxide emissions. 27.3% derive from building operations: heating, cooling, lighting, and other activities. The remaining 15% is “embodied carbon”: the emissions related to material production and construction of buildings and infrastructure.
GLOBAL FLOOR SPACE WILL
DOUBLE
BY THE YEAR 2060
Next, that the global building stock will nearly double before 2050. That means a New York City’s worth of new buildings every month for the next several decades. This breakneck rate of growth demands immediate and sustained action in our work.
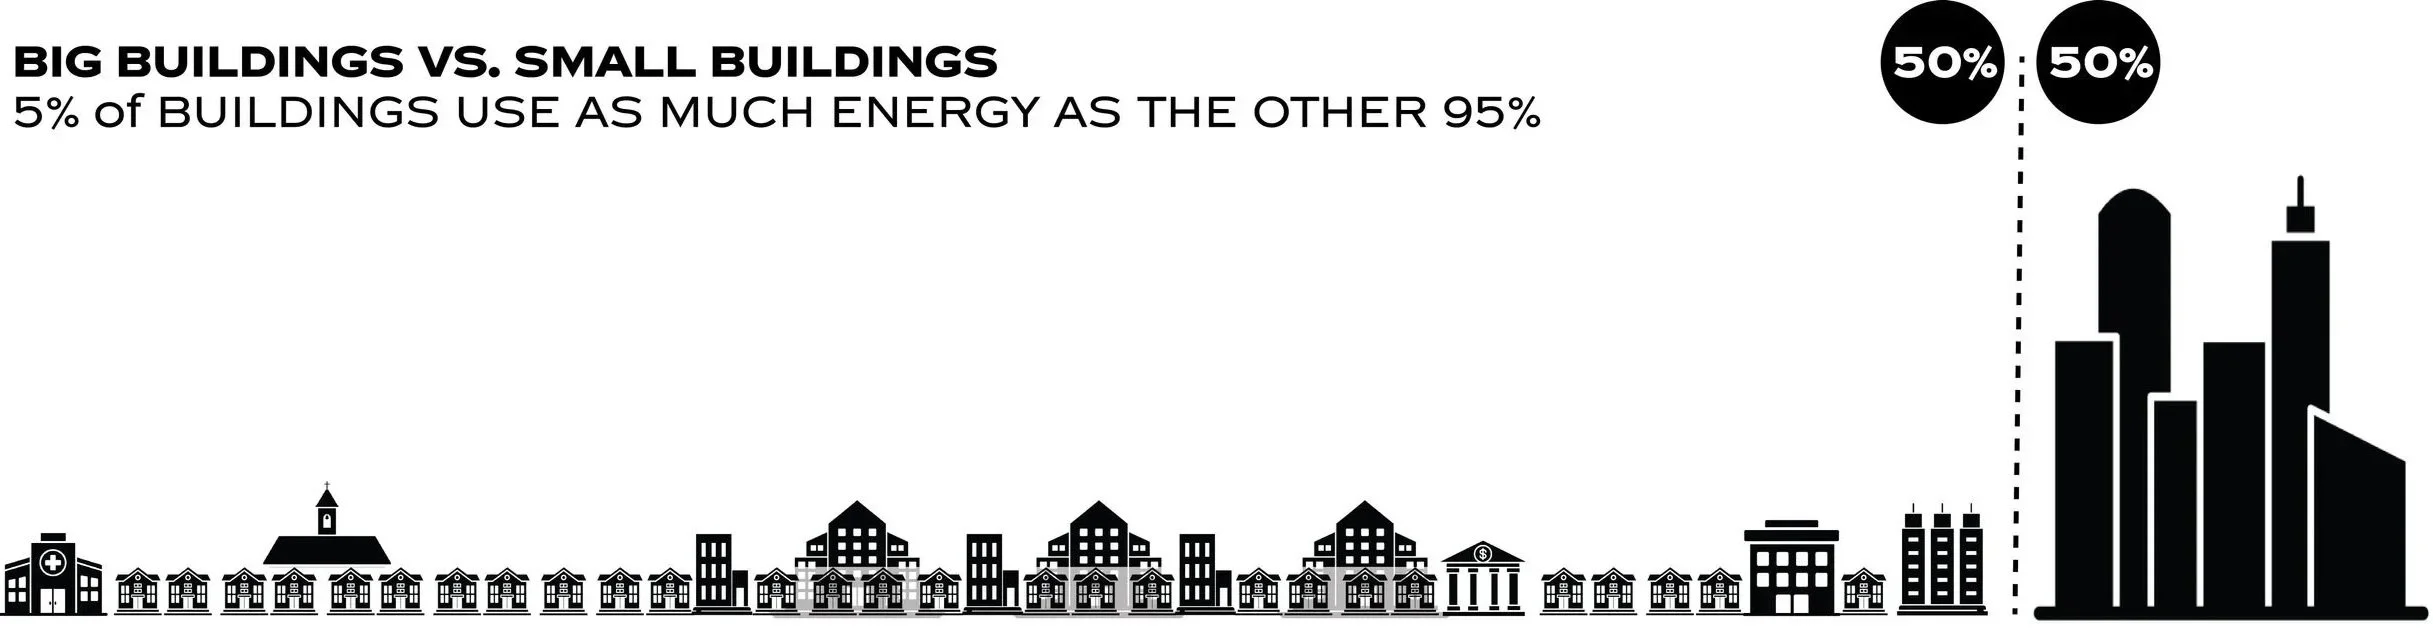
And finally, we know that a small subset of buildings is responsible for the lion’s share of building-related emissions, and that best practices applied to those projects will go the farthest in helping us reach the goals of the Paris Climate Agreement.
Based on visual by Architecture2030
THE ROADMAP
Architecture 2030 provides clear goals for the built environment: that all new buildings and renovations be designed for operational carbon neutrality, and that the built environment reach zero embodied carbon by 2040.
The following six posts in the Cathedral Thinking series will explore how we in the design-build community, and more specifically in the curtain wall industry, can can address these facts and thus contribute to goals of Architecture 2030 and the Paris Climate Agreement. There are a variety of strategies, old and new, that must be pursued in reducing the long term energy demand of buildings while also mitigating the upfront emissions of the building process.
Though Innovation Glass is one small player in a dynamic market, we will continue working with architects, glaziers, and our competitor curtain wall suppliers to meet the urgency of this moment in human history.
Next up in the Cathedral Thinking series is In Pursuit of Net Zero: Thermal Performance & Building Skin Enhancements in Curtain Wall Design. The following posts will explore specific topics in embodied carbon: adaptive reuse of buildings, the circular economy, mass timber, and more.
Stay tuned!
FOOTNOTES
[1] Per the Environmental & Energy Law Program, Harvard Law School: The first Trump administration announced the United States’ withdrawal in 2017; the withdrawal took effect on November 4, 2020. President Biden initiated the country’s return on January 20, 2021, and the United States formally rejoined on February 19, 2021. The second Trump administration notified the United Nations of another withdrawal on January 27, 2025; it took effect on January 27, 2026.
-
The left pie chart depicts global GHG emissions (all types) in carbon dioxide equivalent, and the right pie chart depicts a breakdown of carbon dioxide emissions by sector.
This chart was compiled by Innovation Glass in an effort to better visualize the complexities of global climate change. It should not be used as an authoritative reference on total numbers, but rather a reference to approximate scope of operational and embodied carbon of the built environment in the broader context of global greenhouse gas (GHG) emissions. Emissions from the built environment are almost entirely CO₂, which is just one of four main types of GHGs. This chart scales the emissions of the built environment to their relative size by adding all emissions in CO₂ equivalent.
-
The total amount of GHG CO2 equivalent is from Emissions Data for Global Atmospheric Research (EDGAR). The CO2 by source percentages are derived from visuals by Architecture2030, which cites the International Energy Agency dataset in compiling end-use CO2 emissions.
-
The discrepancy in total numbers between EDGAR and IEA is due to different methodologies and years referenced as new data becomes available. These numbers should be used as approximate references, not exact figures.
Four types of gasses compose human related emissions: carbon dioxide, methane, nitrous oxide, and fluorocarbons. Methane, nitrous oxide, and fluorocarbons are all significantly more potent green house gasses than carbon dioxide, with varying atmospheric lifespans. To measure them all alongside one another, we use CO₂ equivalent, which scales a unit of methane, nitrous oxide, or fluorocarbon to its global warming potential (GWP) compared to one unit of carbon dioxide. Those GWPs are as follows: methane (CH₄), 28; nitrous oxide (N₂O), 273; and fluorinated gases vary but are generally in the thousands.
The numbers in this chart not account for emissions and sinks related to land-use change.