In Pursuit of Net Zero: Operational Carbon, Thermal Performance & Building Skin Enhancements in Curtain Wall Design
August 2026 was the hottest month on record, and the last 11 years have been the hottest 11 on record [1]. This rapid increase in global surface temperatures is directly linked to the emission of greenhouse gases. Of those emissions, 27.3% of global CO₂ emissions come from operational carbon in the built environment: fossil fuels burned for the heating, cooling, and powering of buildings.
The Paris Climate Agreement laid out national goals for emission reductions rather than sector-specific targets, so we look to the World Green Building Council (WGBC), among other leaders in the space, for guidance in reducing operational and embodied carbon in the built environment. The WGBC’s challenge to designers and builders is the “total decarbonisation of the built environment by 2050”—more specifically, to “ensure all new buildings operate at net zero carbon by 2030 and that all existing buildings are renovated to operate at net zero carbon by 2050.”
Achieving that goal will be a steep climb, and the curtain wall industry has a key role to play in solving the problem. As seen in Figure 1, operations in the built environment are responisble for 27.3% of global carbon dioxide emissions, and the cooling of space and the ehating of space and water are resonsible for more than half of those emissions.
Figure 1 ○ Sources & Methodology ↓
OPERATIONAL CARBON
IN THE BUILT ENVIRONMENT IS
27.3%
of GLOBAL CO₂ EMISSIONS
To state the scope of the problem plainly:
the global operational energy demand of the existing building stock is responsible for 27.3% of global CO₂ emissions [2];
the building stock is projected to nearly double by 2050 [3];
as the planet warms, space cooling demand alone is expected to triple by 2050 [4];
and to do our part to prevent catastrophic climate change by meeting the the goals of the Paris Climate agreement, we must reach net zero operational carbon in the built environment by 2050.
There are a variety of strategies in the global effort to reach ‘net zero,’ and the term ‘net zero’ has several definitions. Greening the power grid, and phasing out furnaces and boilers in favor of electric options like heat pumps, for example, will contribute significantly towards reducing the operational energy demand of buildings. But, per the WBCG: “As the golden rule of achieving Net Zero, measures that will help reduce energy demand to ensure buildings are highly energy efficient are always prioritised.”
THERMAL PERFORMANCE
VS1: 0.18 U-Value
with triple-GLAZED GLASS UNITS
Achieving peak thermal performance is paramount in the fight to reduce operational carbon in the built environment. By improving thermal efficiency in the long run we can curb peak loads of the built environment and thus reduce overall power demand.
Hybrid Point-Supported systems like VS1 are ideal technologies for glazing new buildings and renovations alike because the reduced thermal bridging achieves better thermal performances. With VS1, contact with the glass and the exterior is minimal, meaning the U-value of the facade closely matches that of the glass. This method of glazing also offers a high level of design flexibility at surprisingly competitive costs.
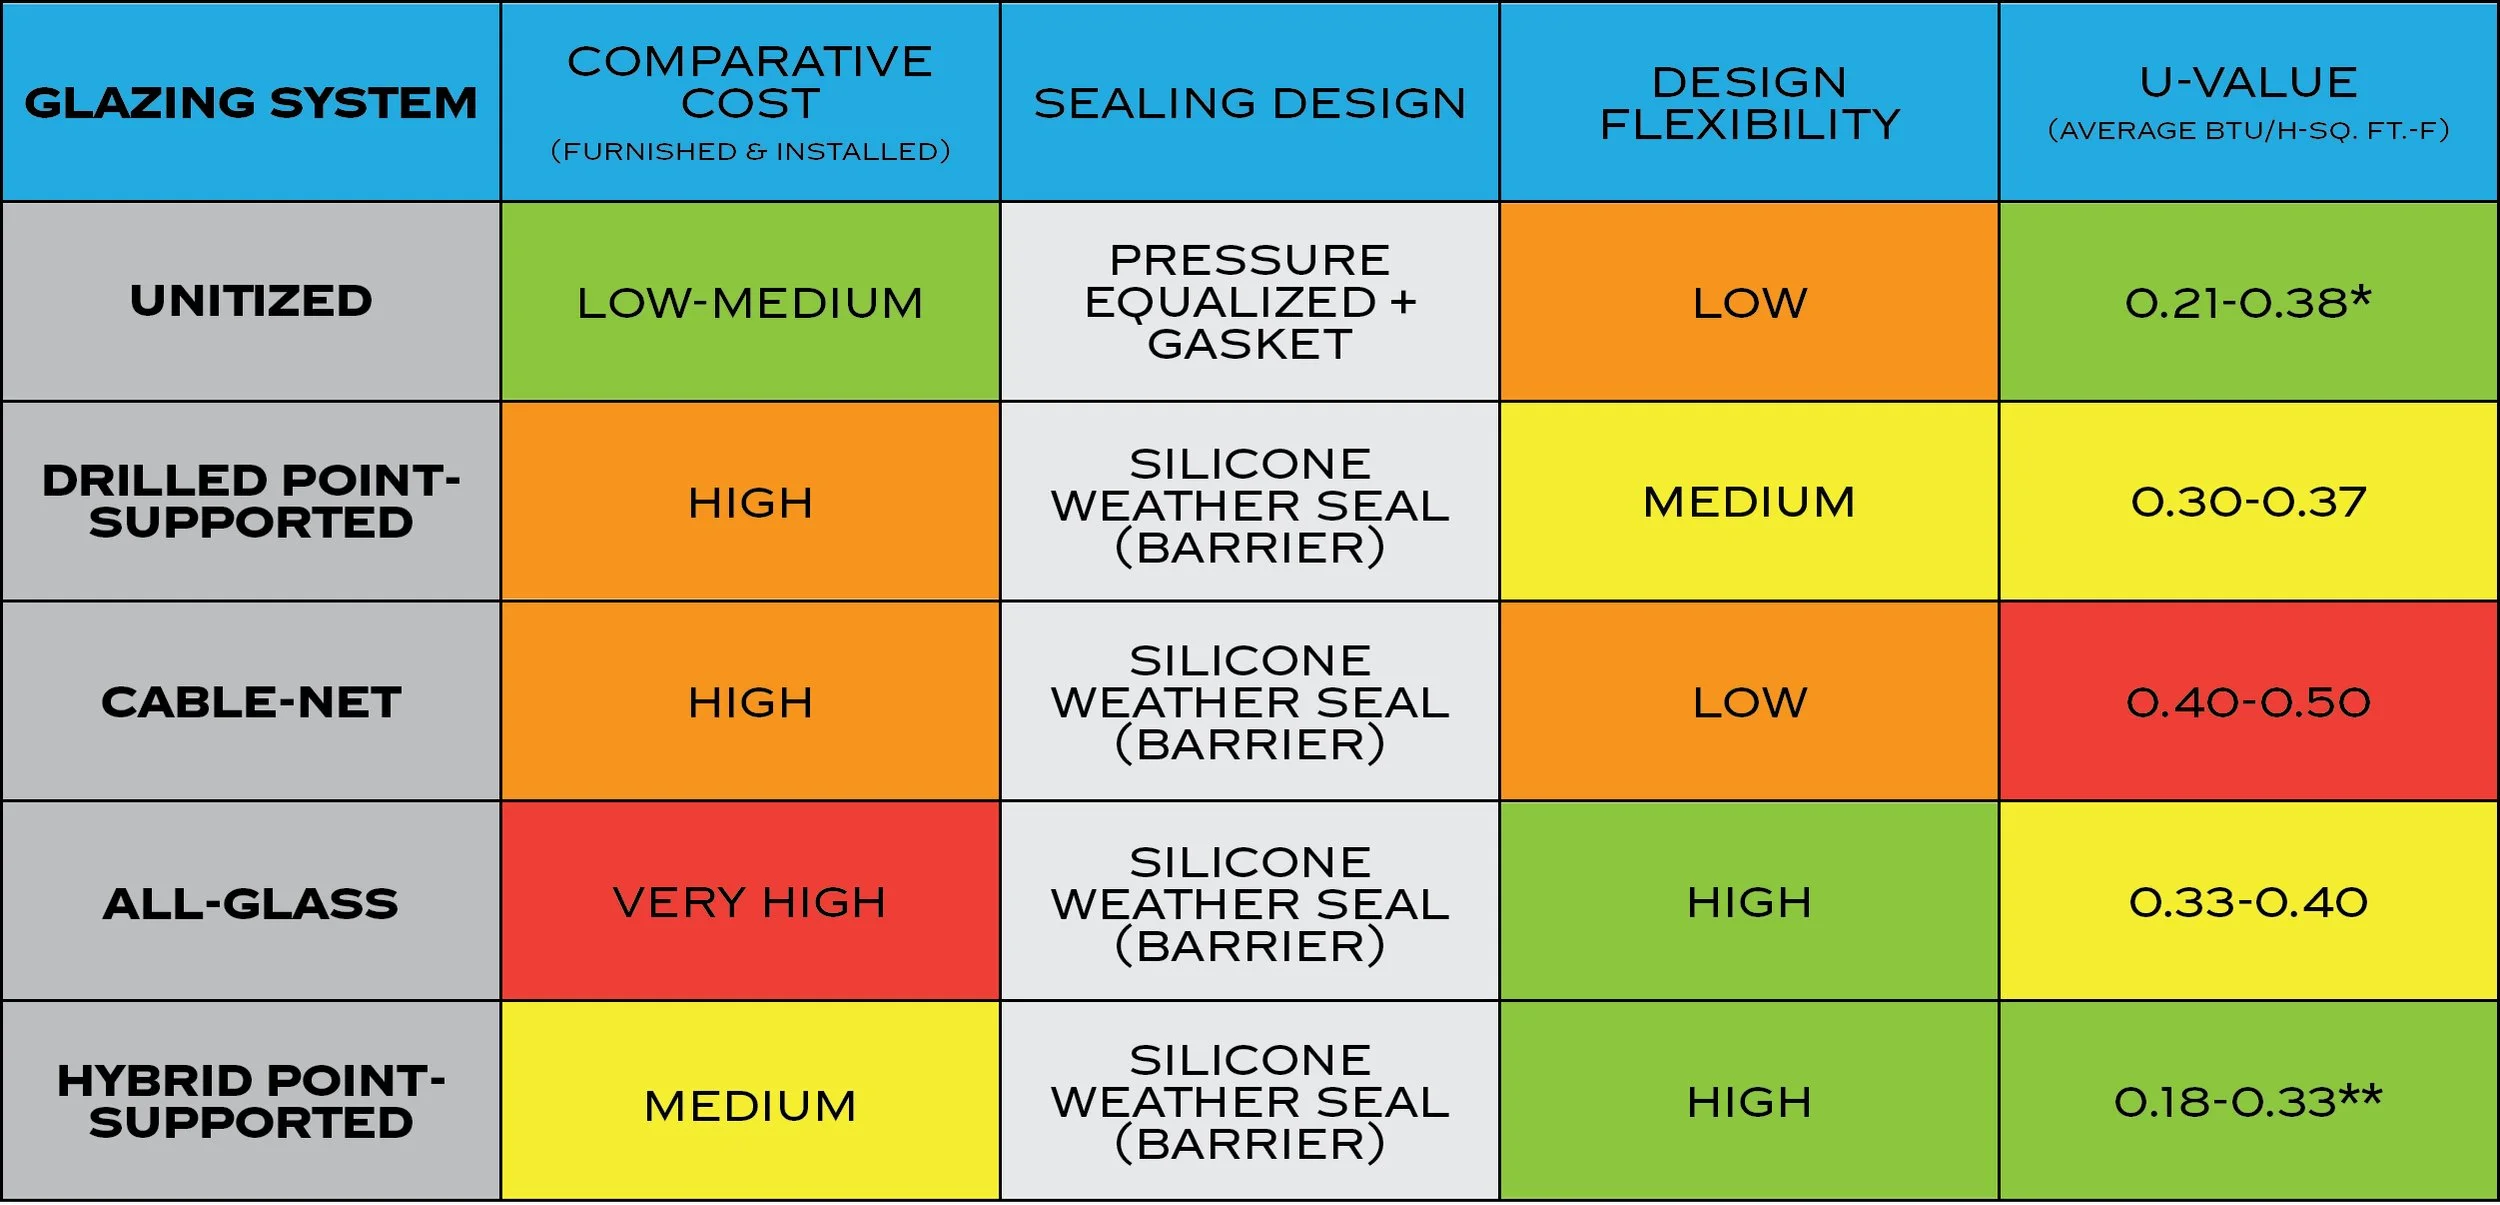
Figure 2
*0.29 achievable with 40% spandrel area; 0.21 possible with triple IGU
**0.18 achievable with triple IGU
VS1: LEaDING IN DESIGN EXCELLENCE
The following projects are examples of VS1’s capacity to meet stringent energy code requirements while also achieving excellence in design. From LEED certifications in the United States to BREEAM certifications abroad, VS1 has helped many architects meet the performance demands of the climate change era.

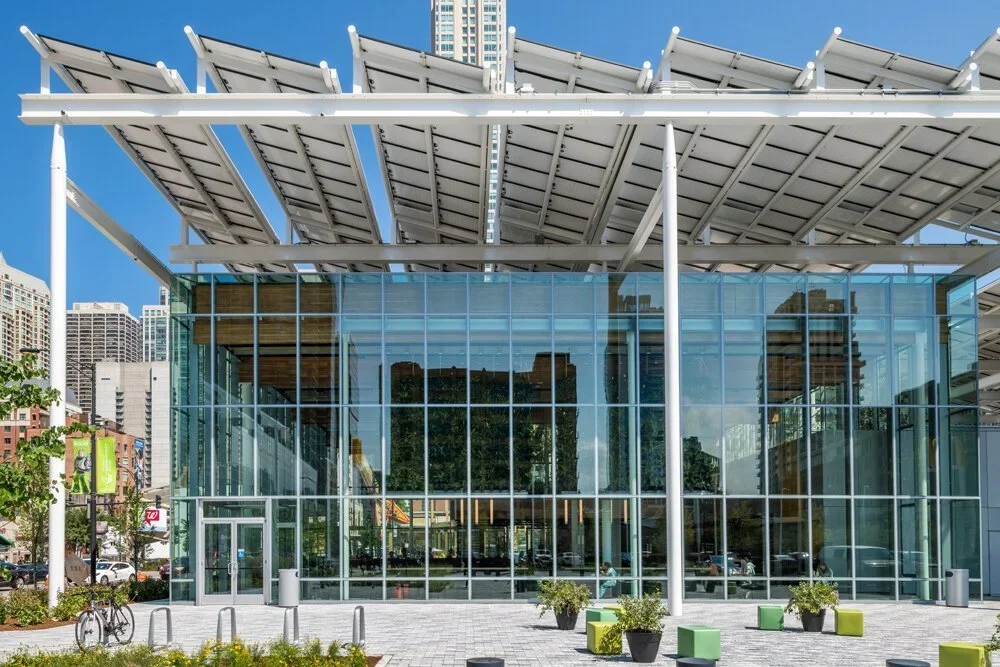
A LEED Platinum restaurant with a wraparound VS1-A110 facade and suspended VS1-enclosed garden.
Project Gallery→
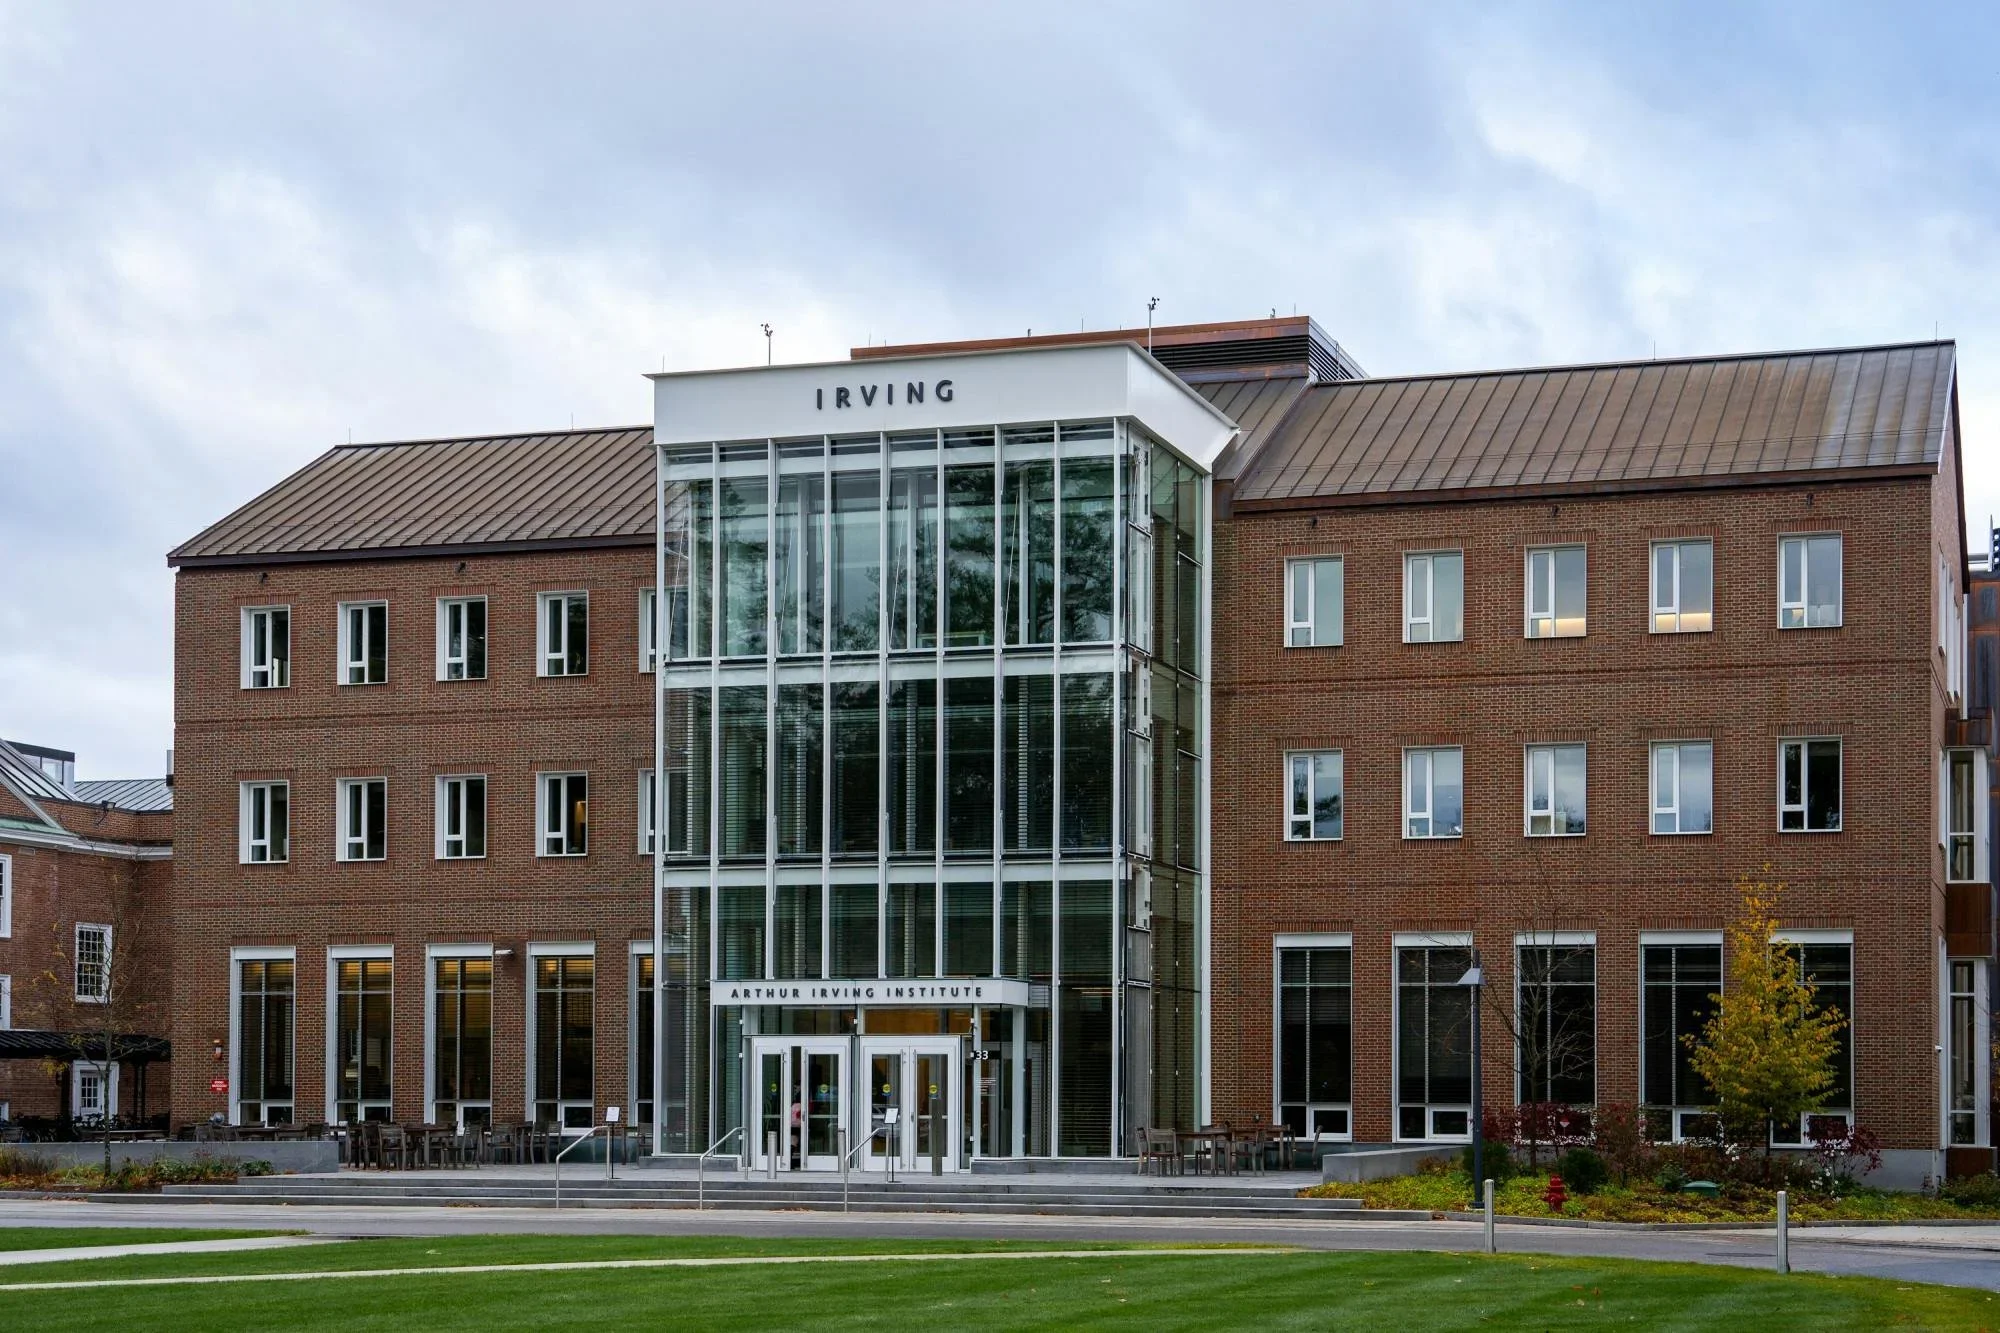
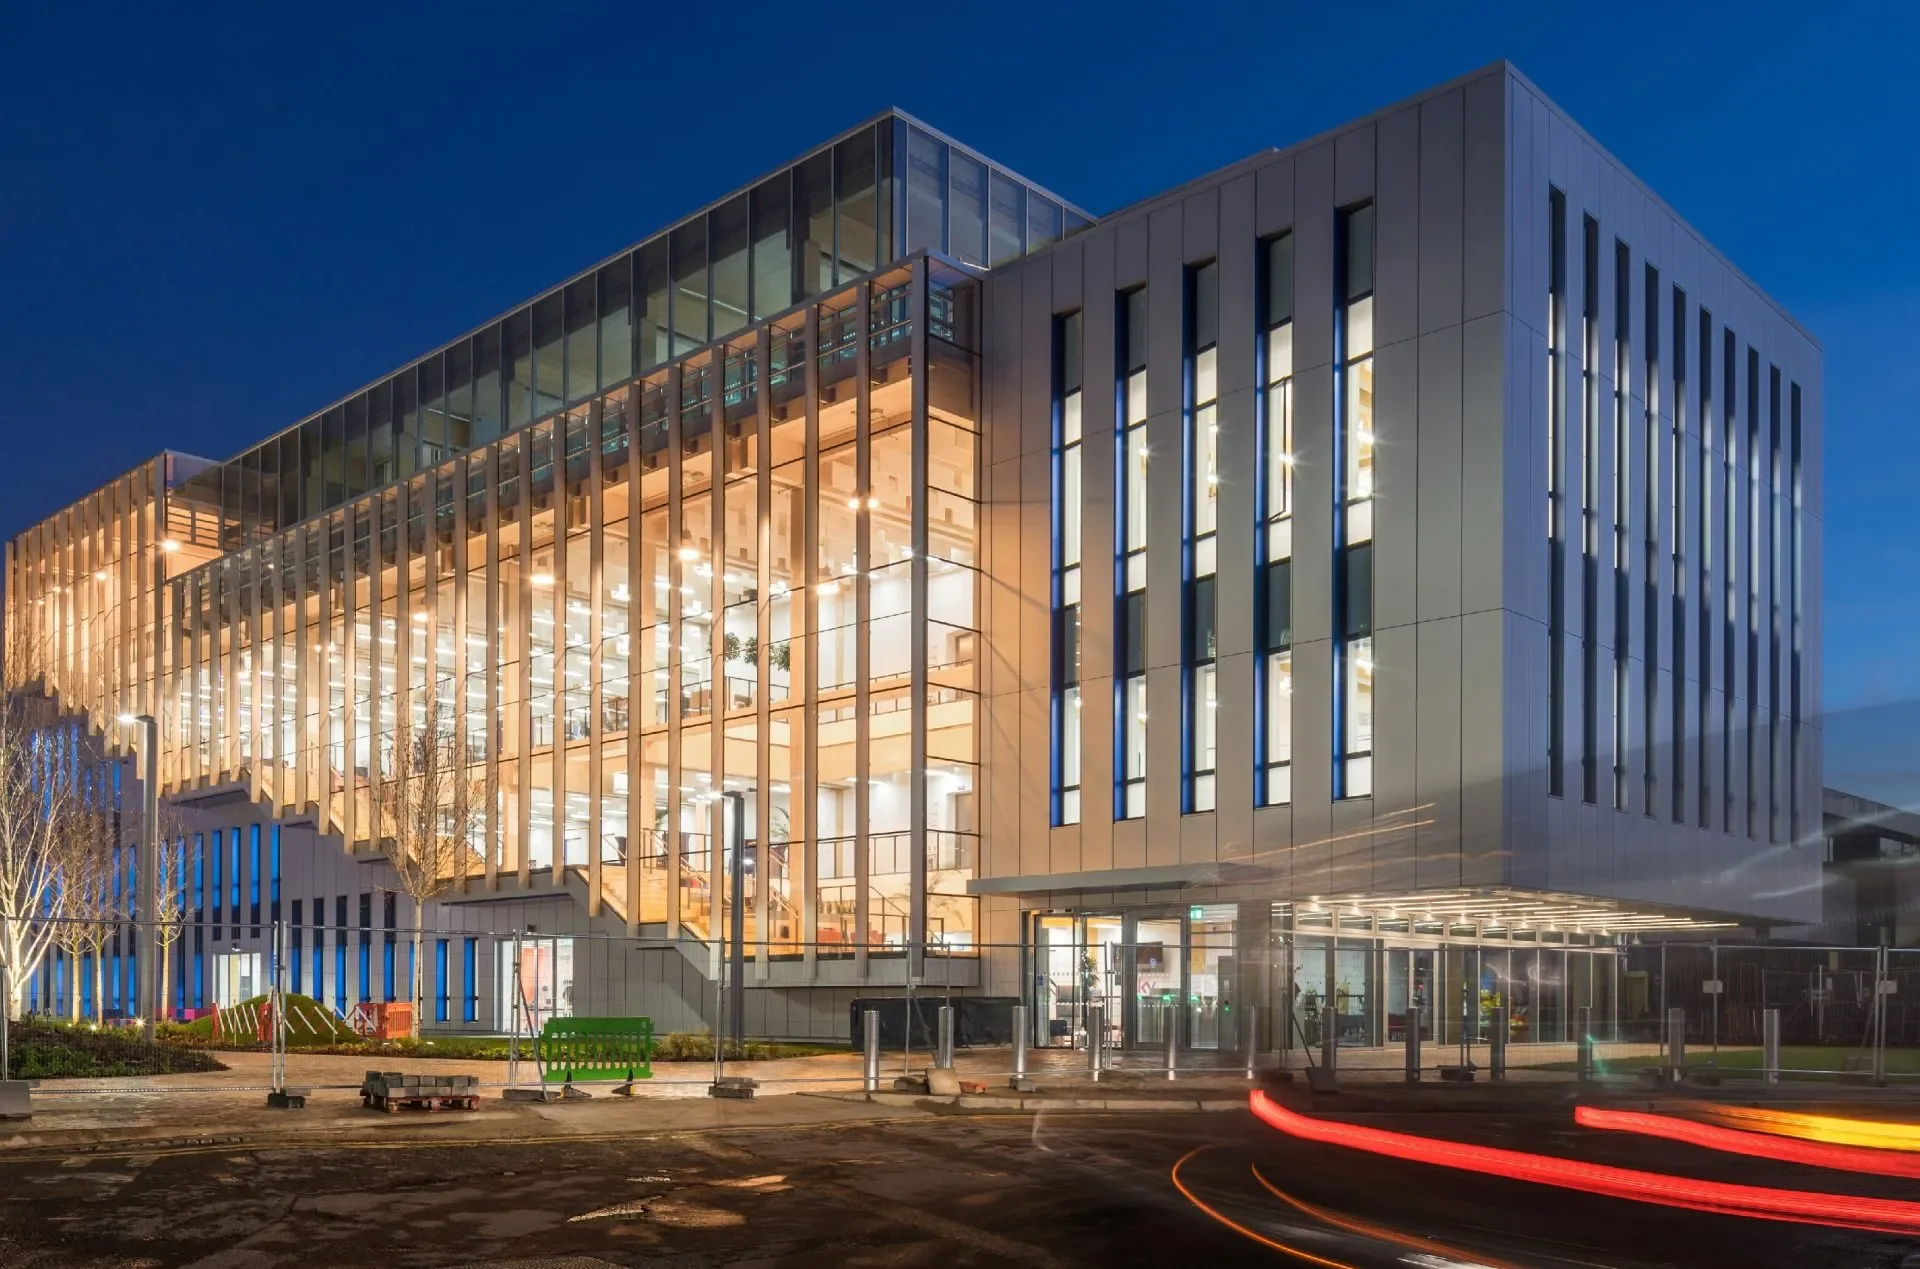
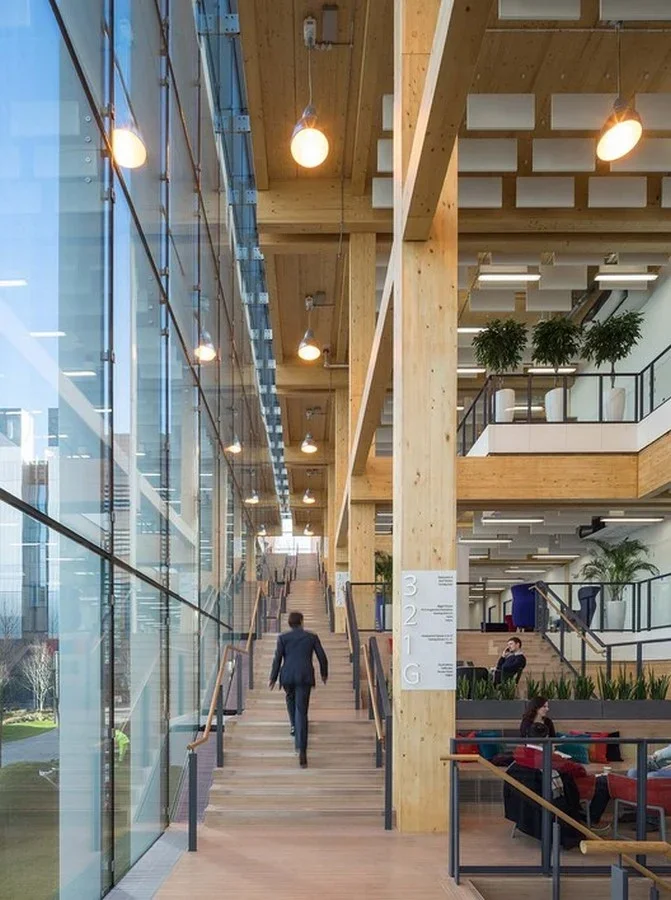
A LEED Platinum academic building featuring a VS1 dual wall with integrated shading and vents.
Project Gallery→
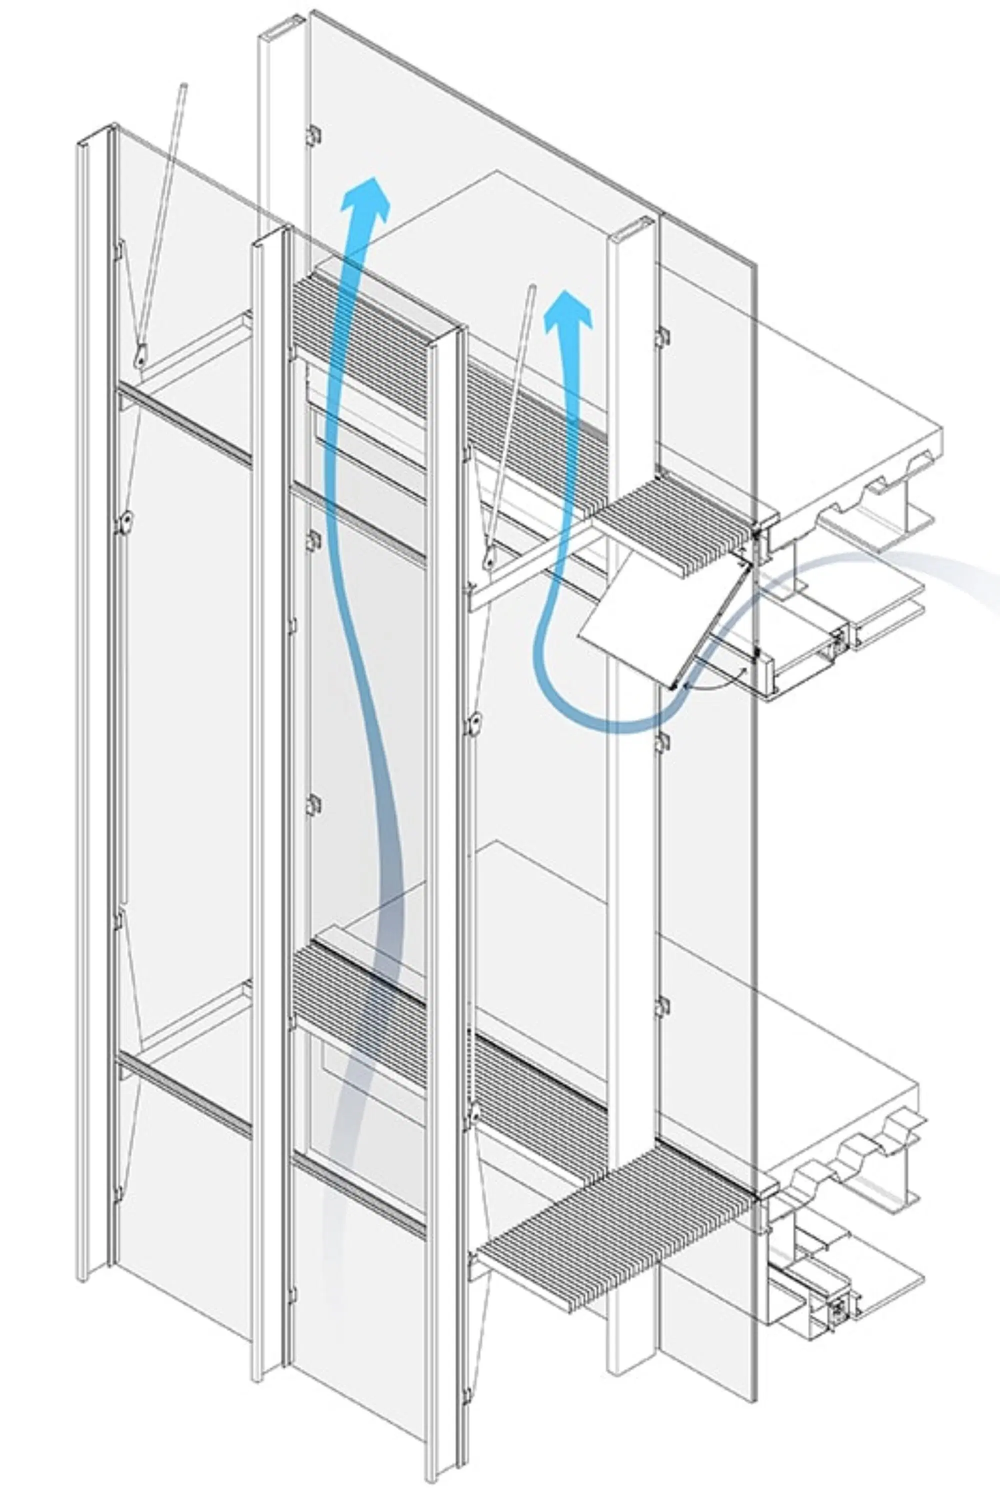

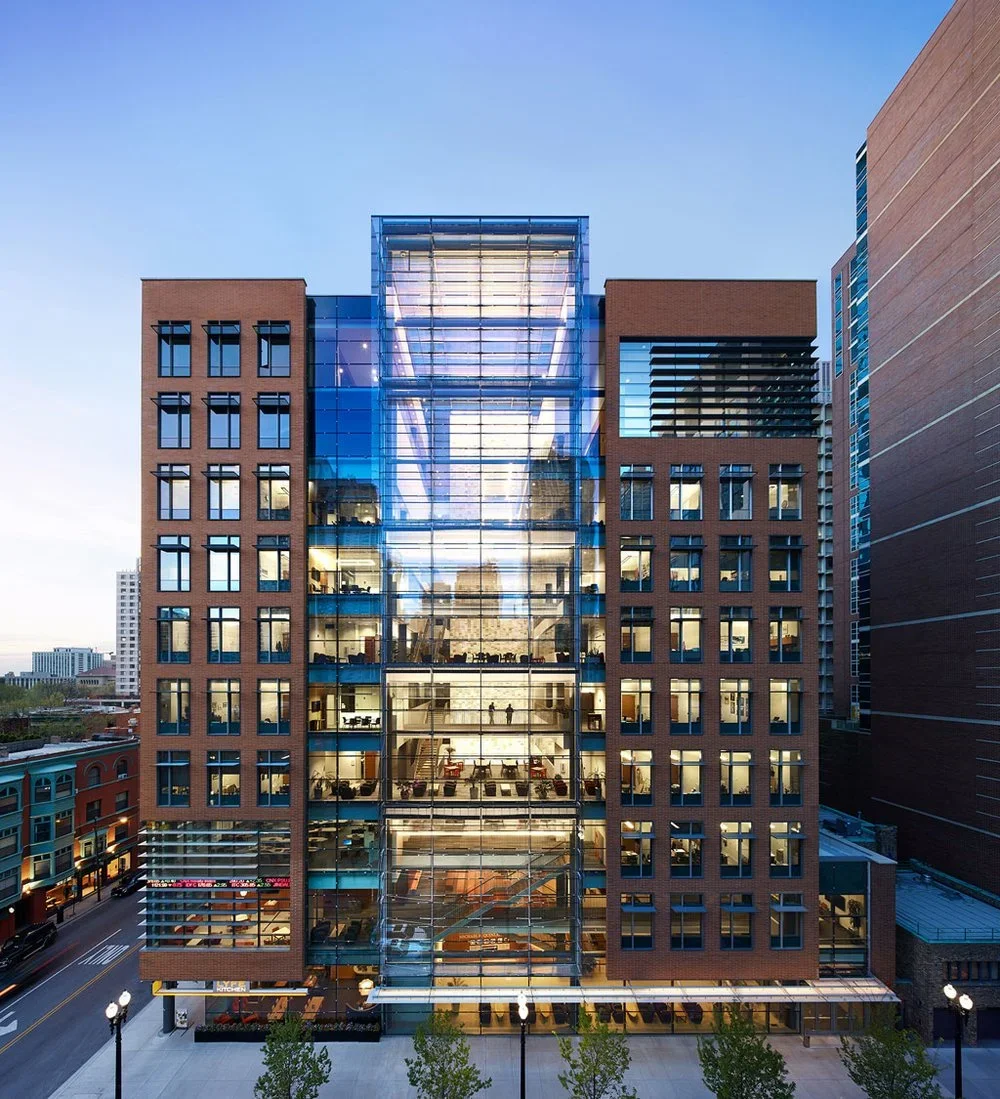
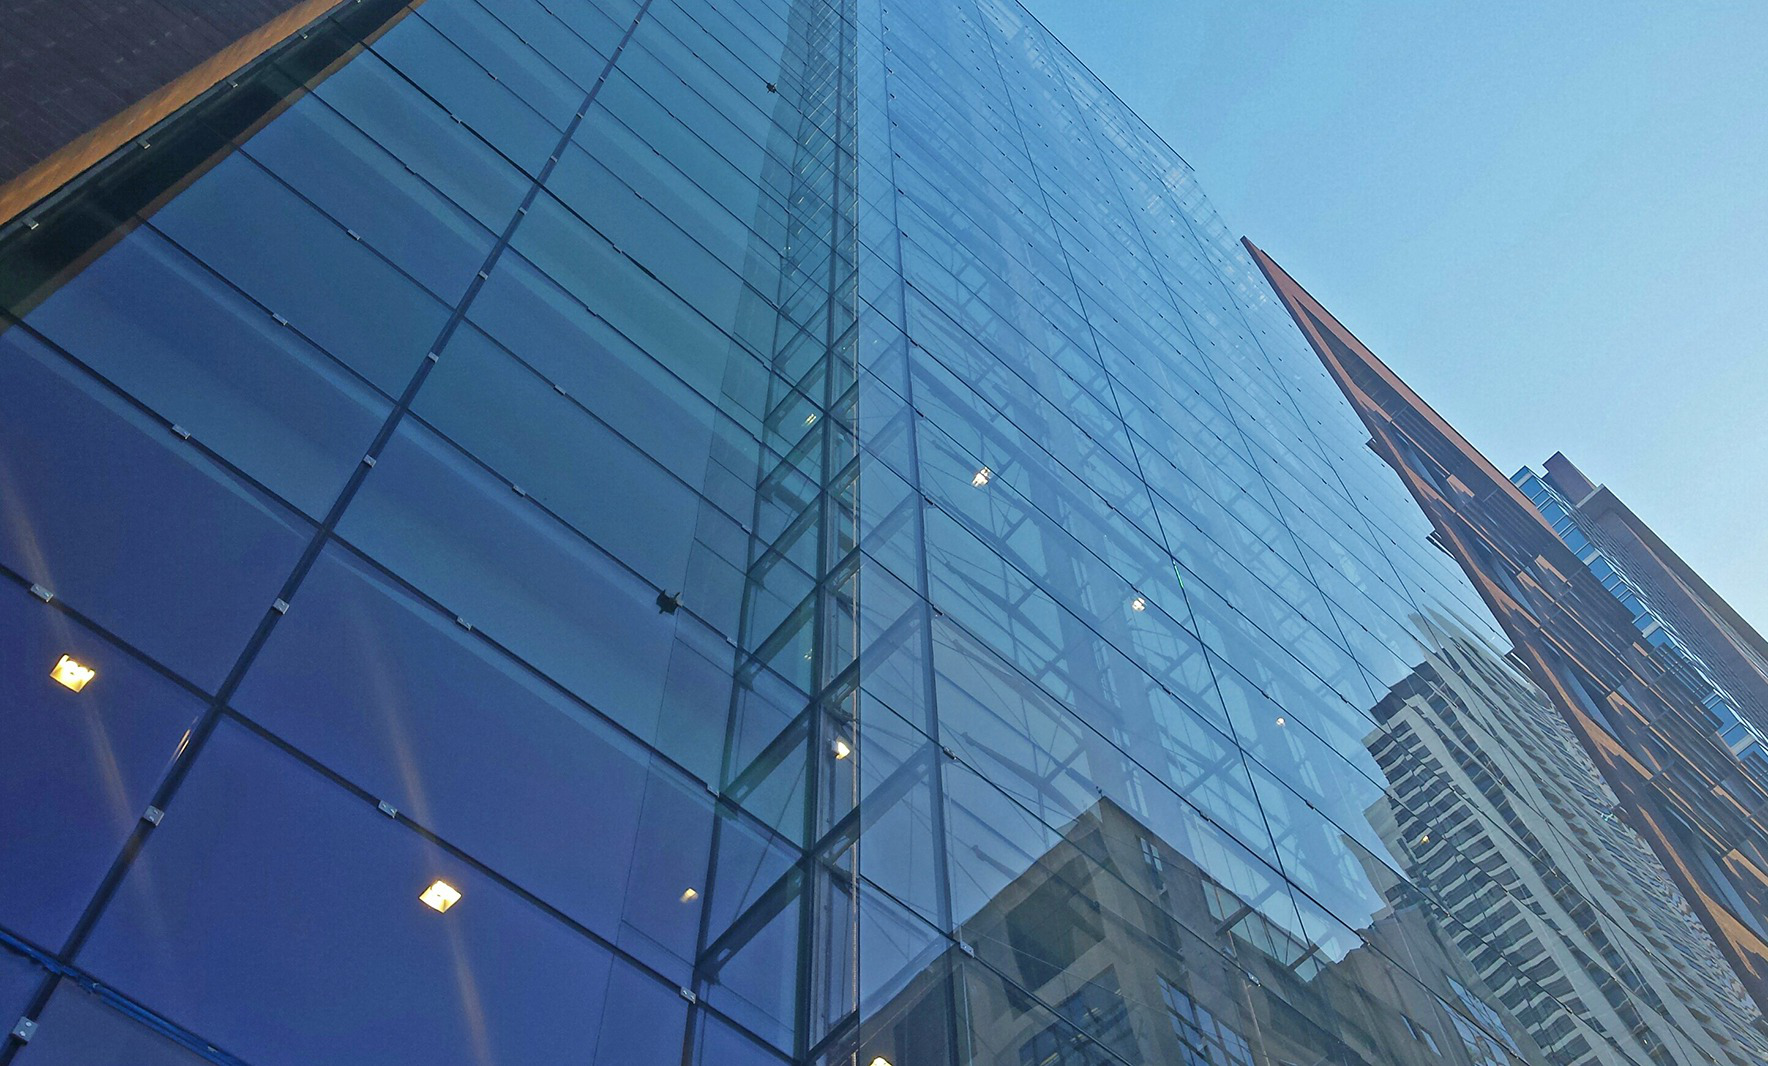
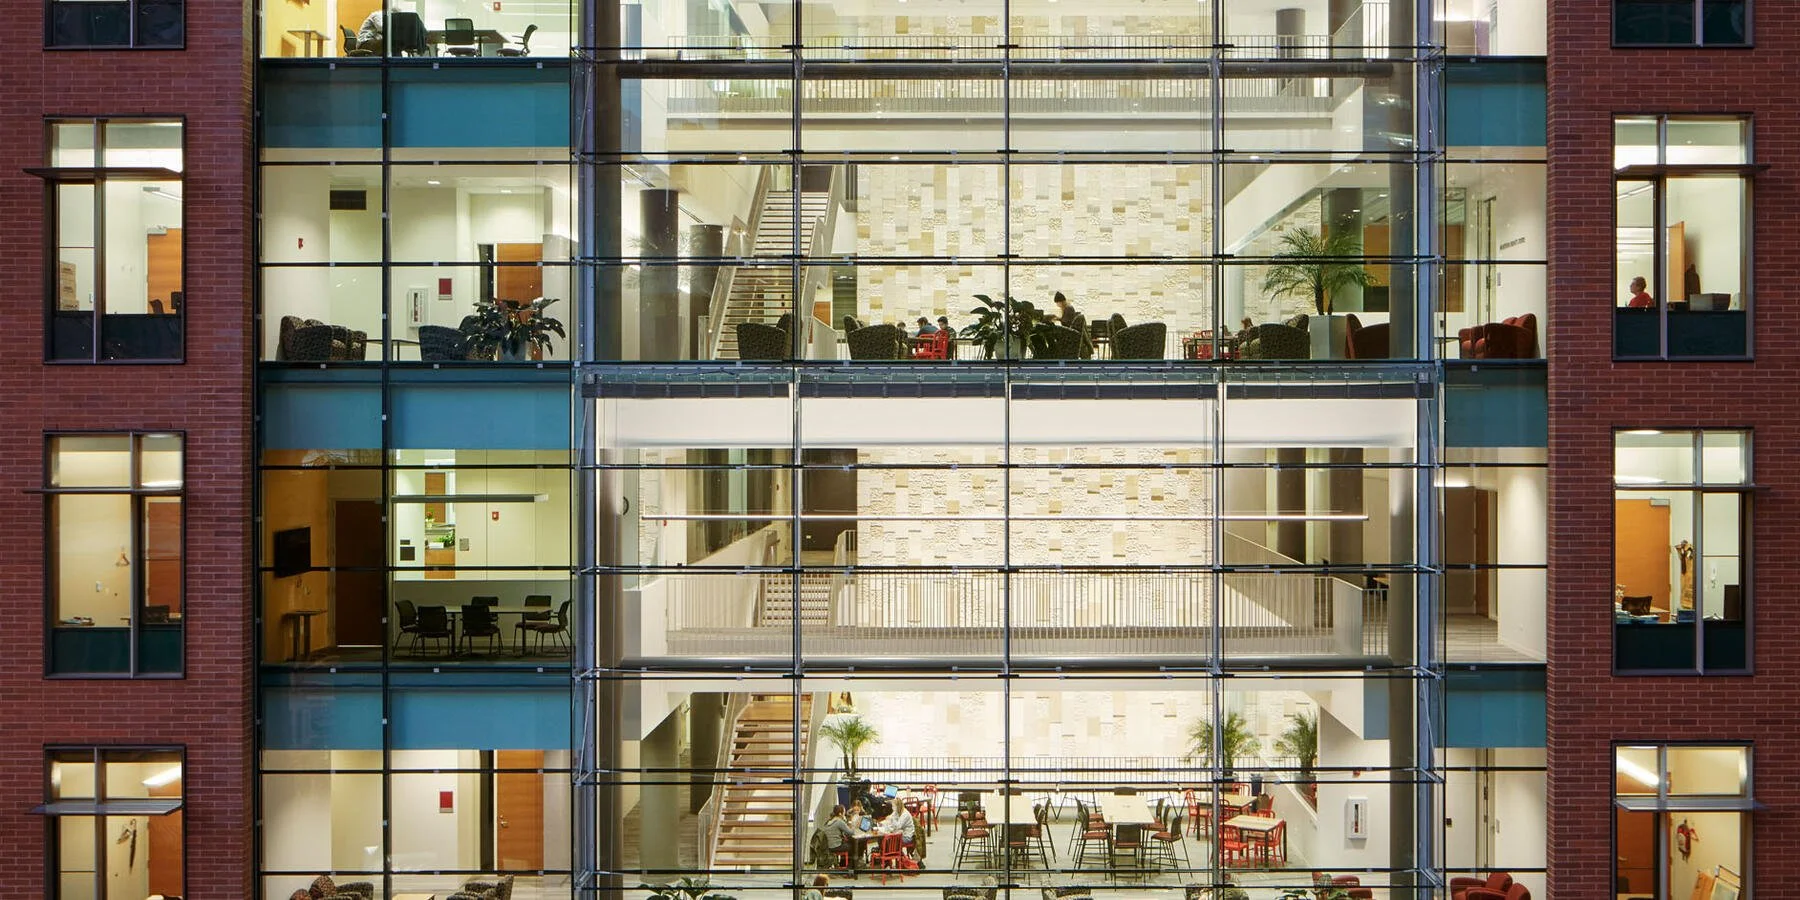
A 10-story VS1 dual wall with awning-style vents of the cavity, which ventilate per the building’s dynamic energy management system.
Project Gallery→
This LEED Gold building features a VS1 facade with sunshades other glass scopes: exterior shading, parapet, canopies, and a glass-enclosed bridge.
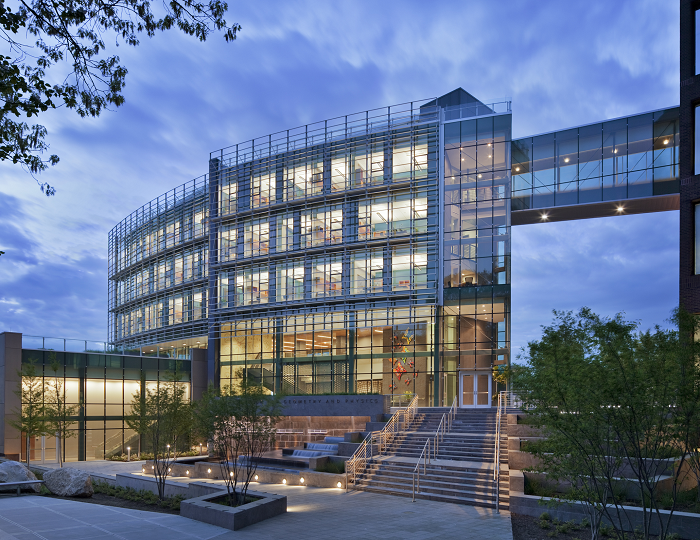


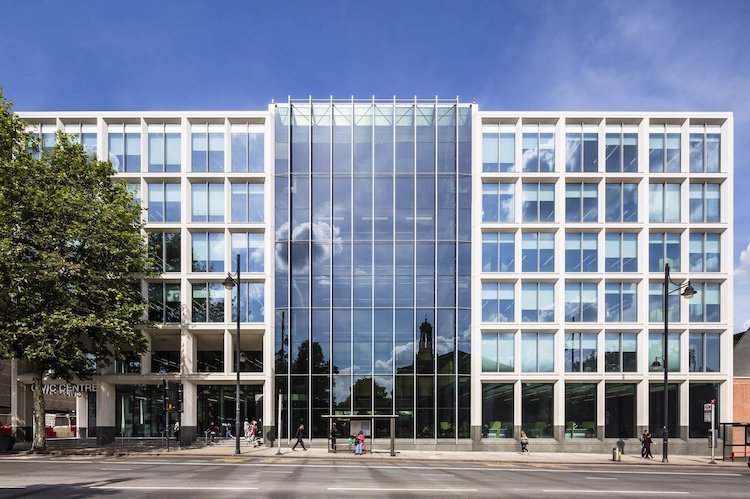
A six-story facade with exterior mullions and “smart glass,” which tints automatically to reduce the building’s heating and cooling load.


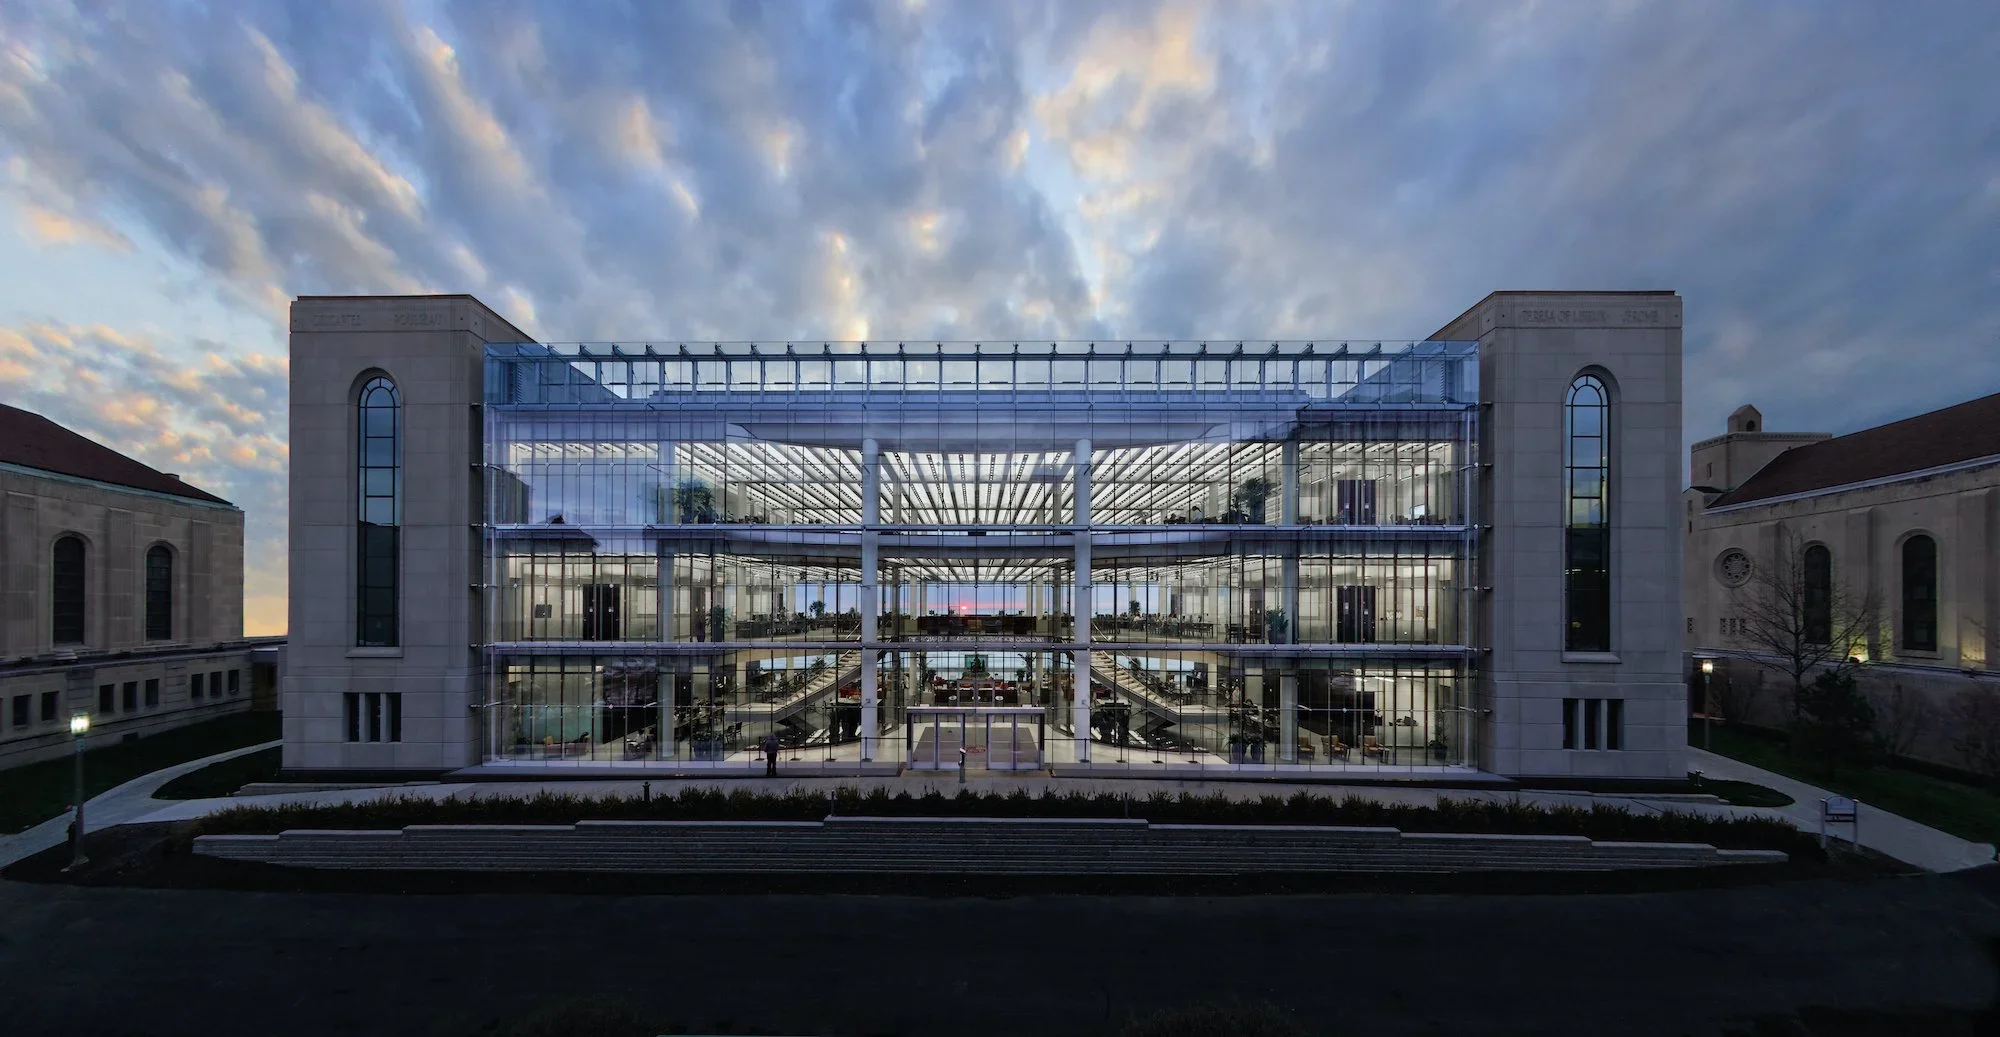
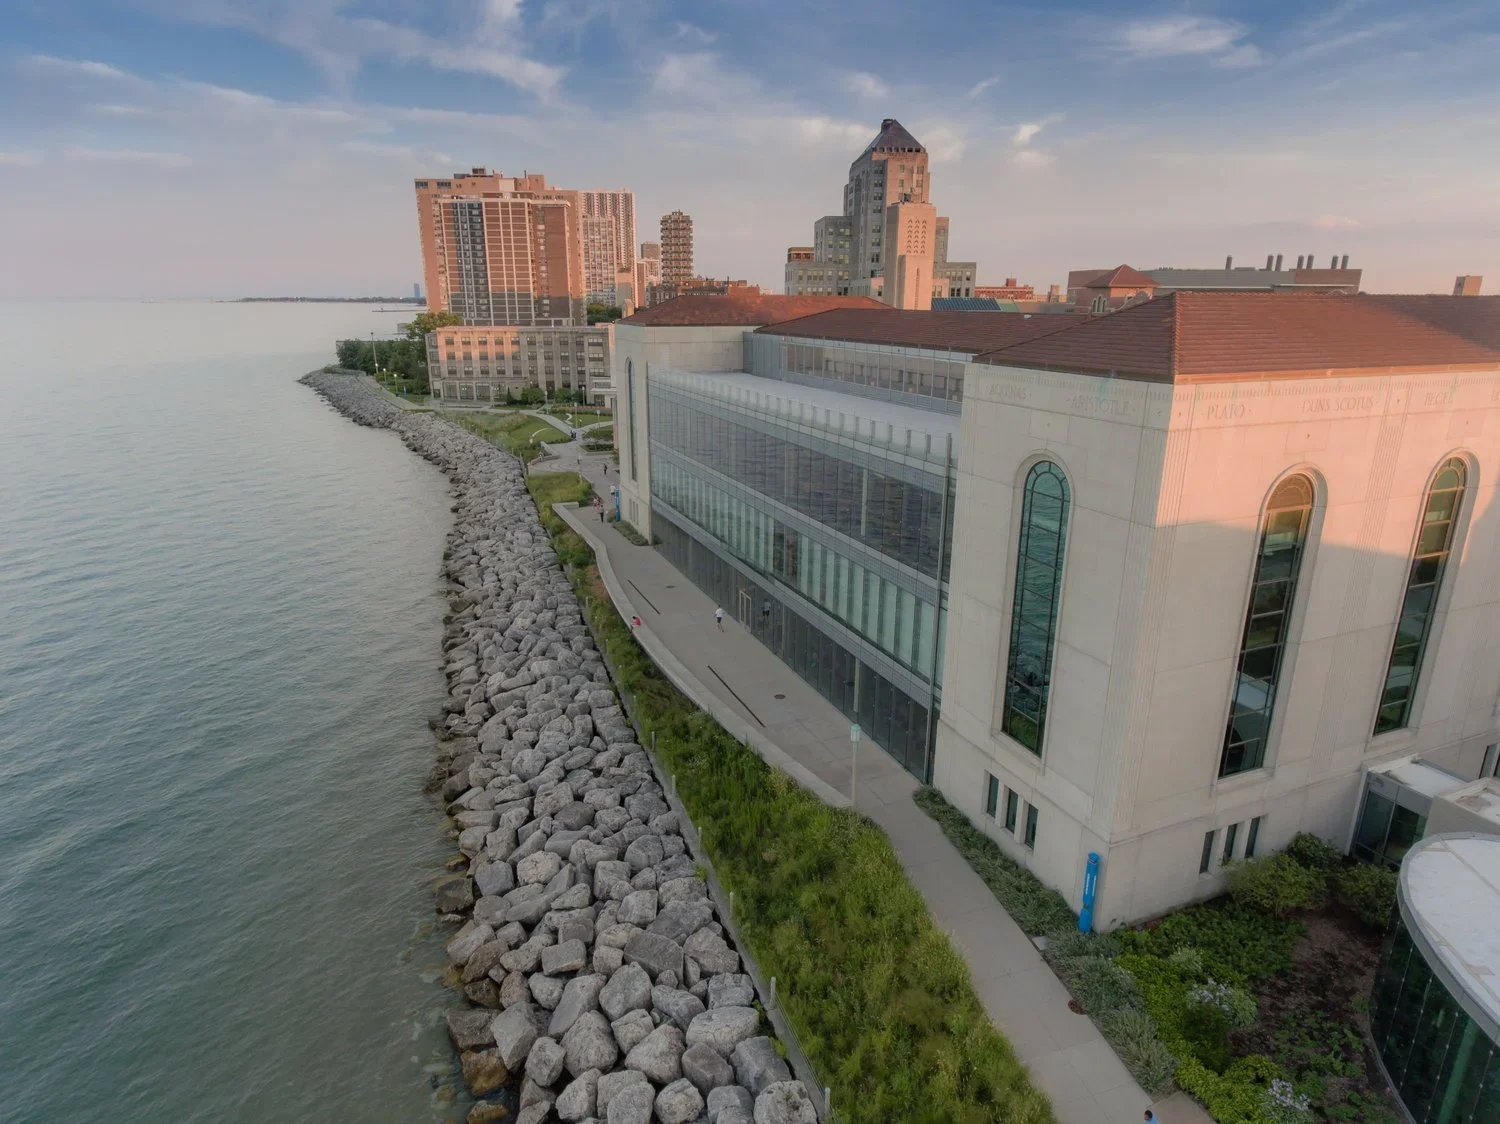
This library at Loyola U. features several VS1 scopes, with ventilation and shading features that integrate into the building’s dynamic solar management program.
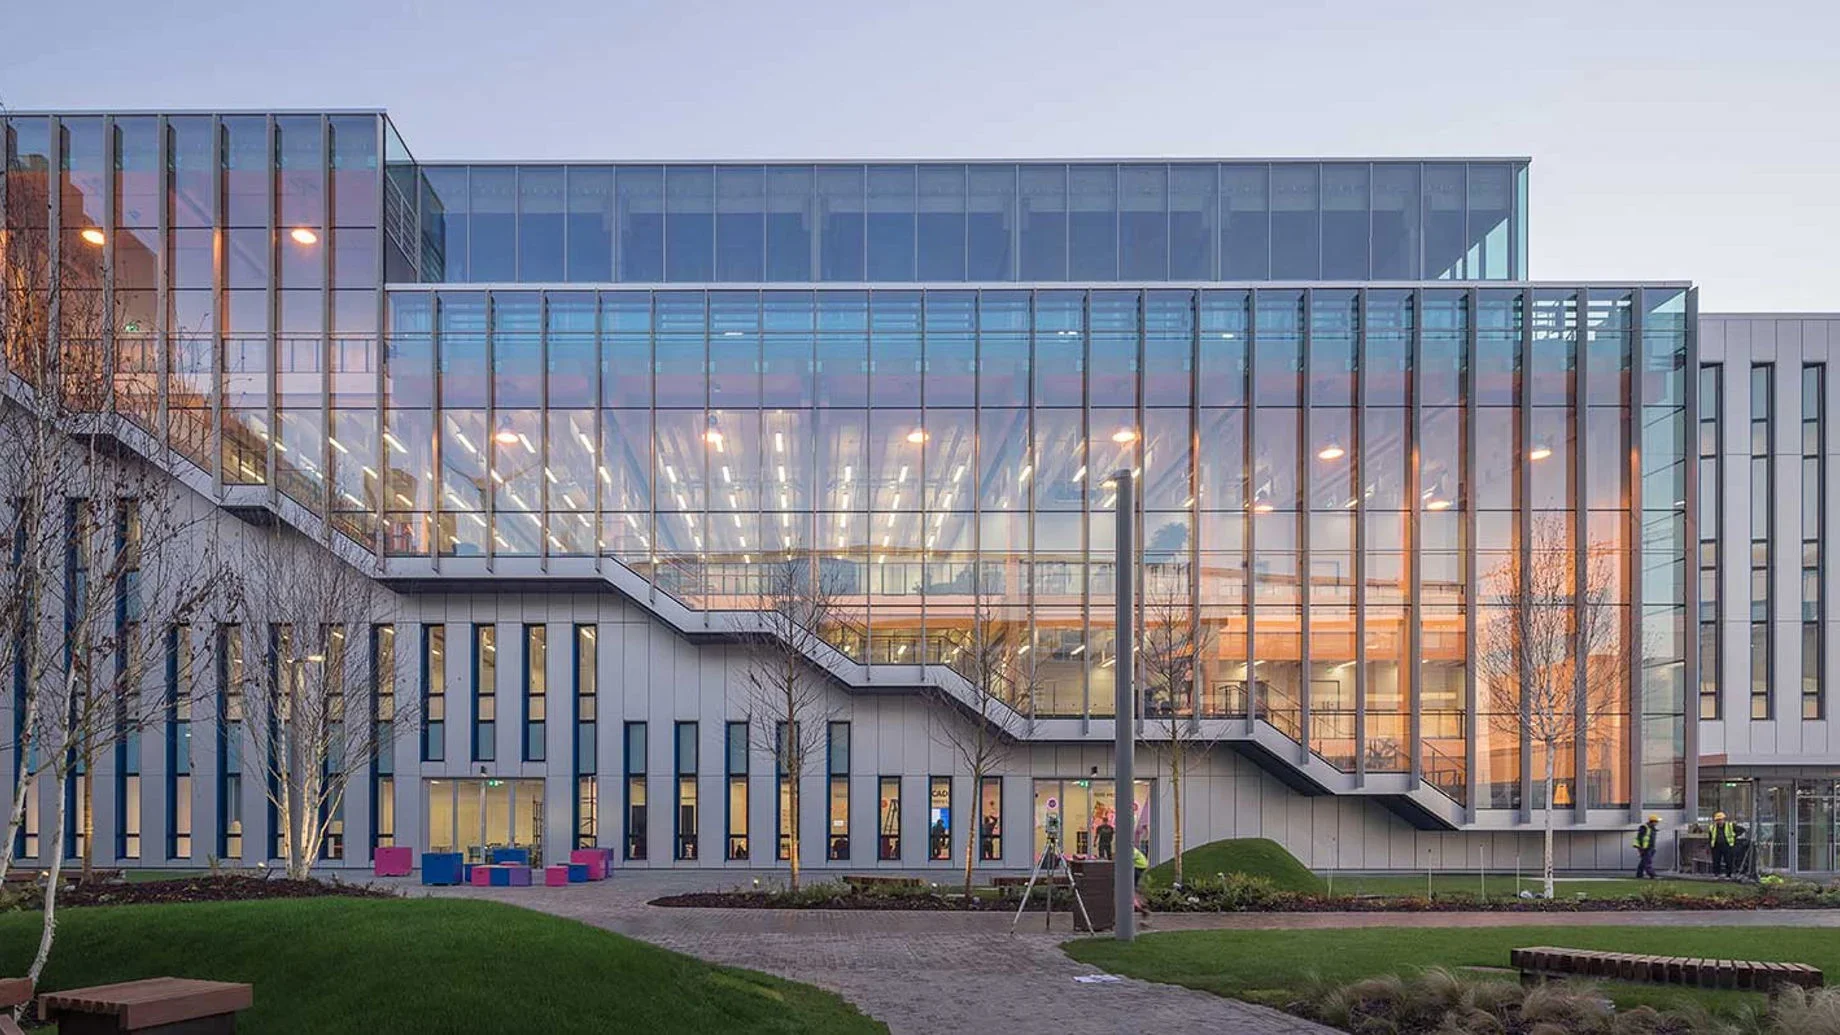
A three-story VS1 facade with exterior mullions and a flush interior. The sill condition slopes with the staircase, the mullions create strong vertical accents.
Project Gallery→
BUILDING SKIN ENHANCEMENTS
VS1 is the curtain wall technology for moving beyond standard vision glazing. Our systems are well suited to accommodate a variety of envelope augmentations, including photovoltaic integration, interior and exterior shading strategies, green walls, electrochromic glass (commonly known as “smart glass”) and zero sight-line vents.
These enhancements can all contribute significantly to the reduction of a building’s operational carbon. Moreover, with VS1, such additions can be made after the initial facade installation, offering building owners and designers exciting opportunities to improve a building’s performance in the future.

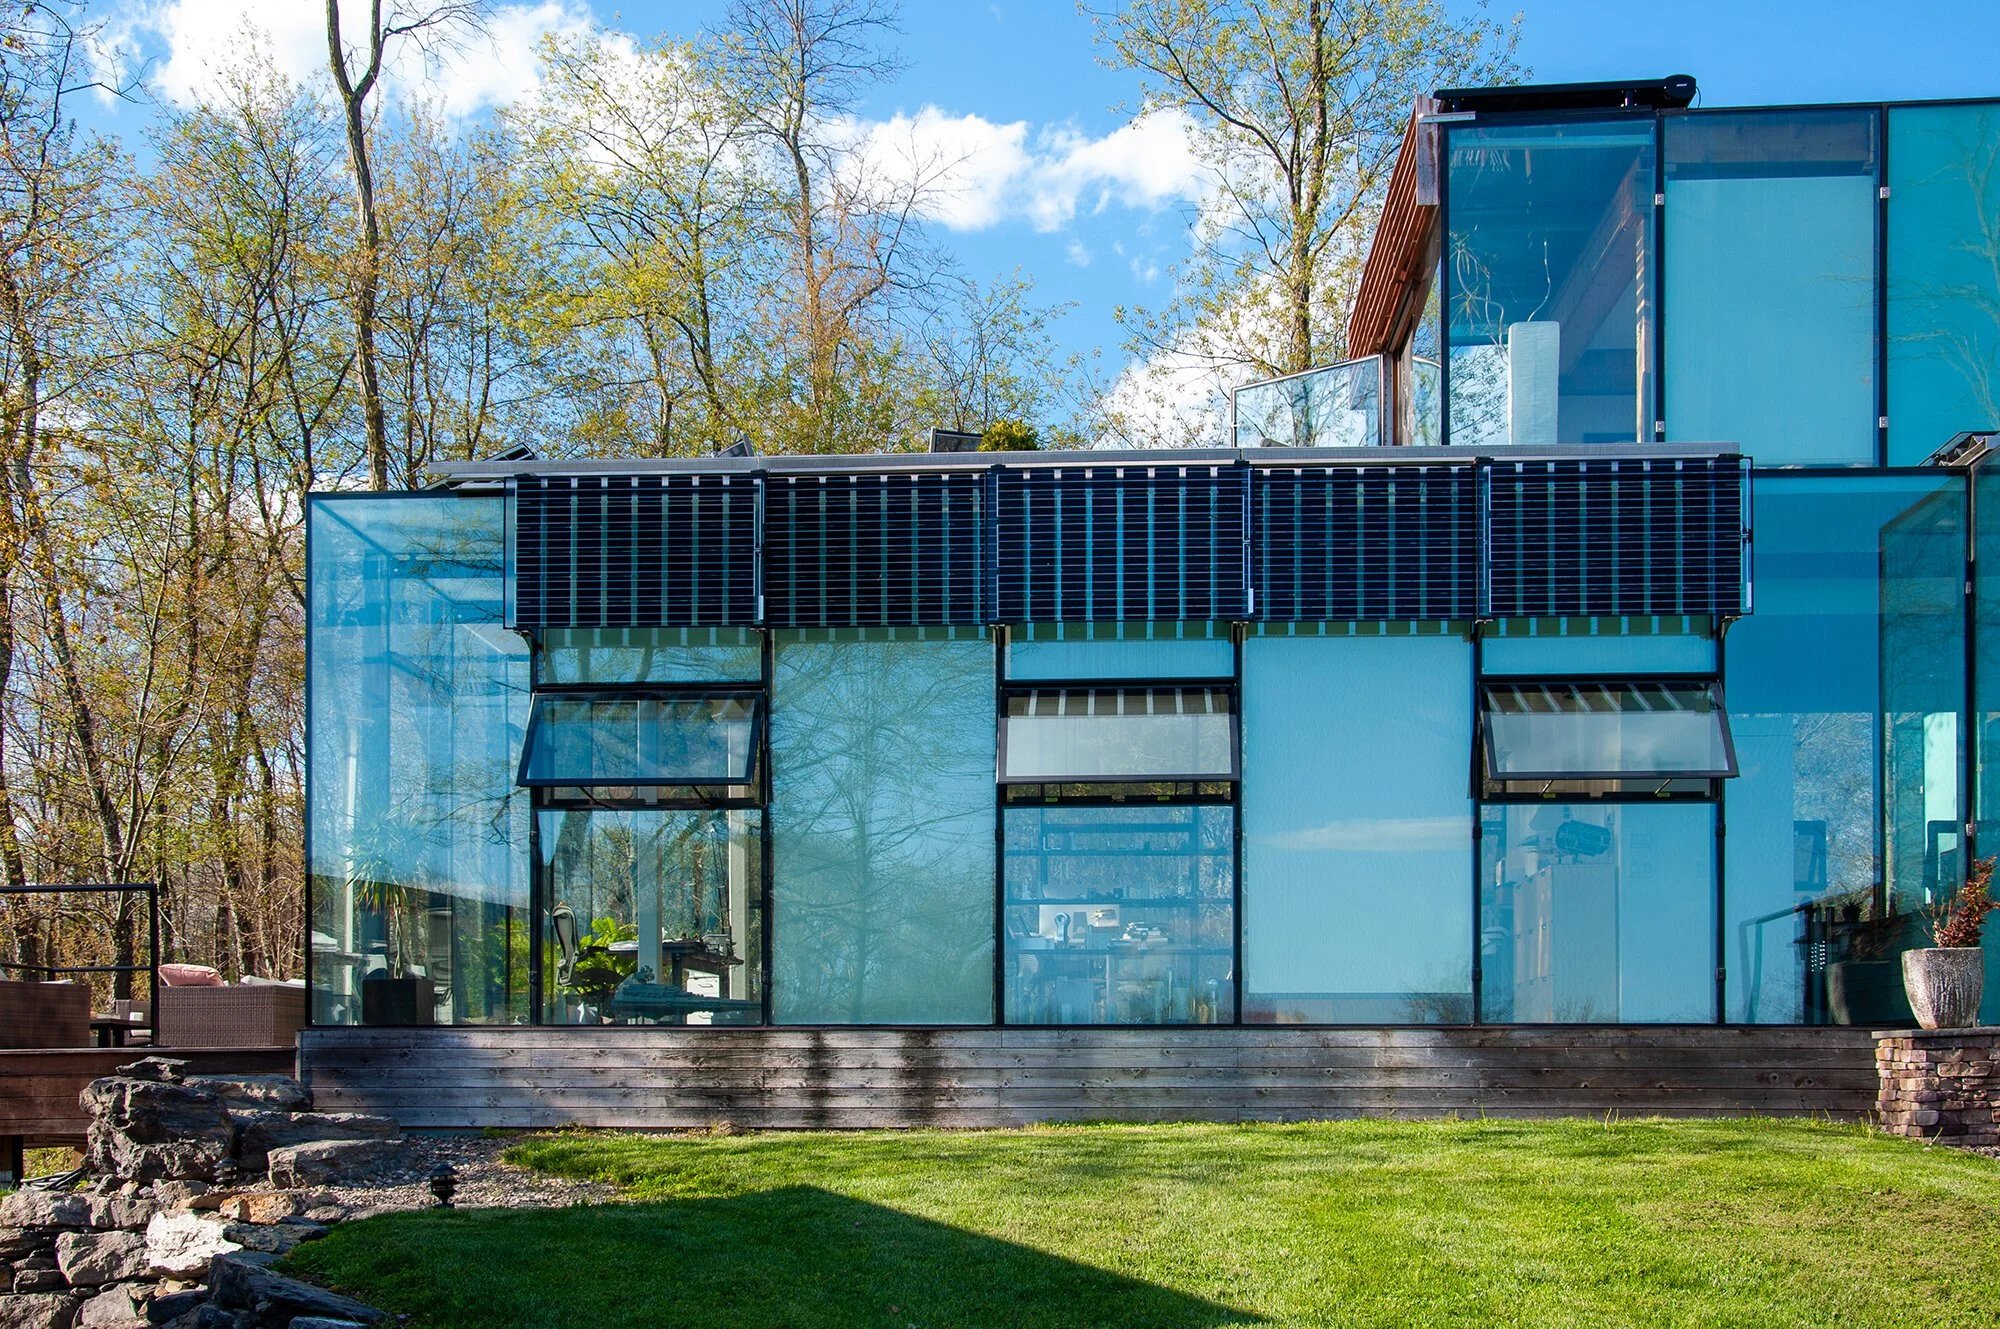
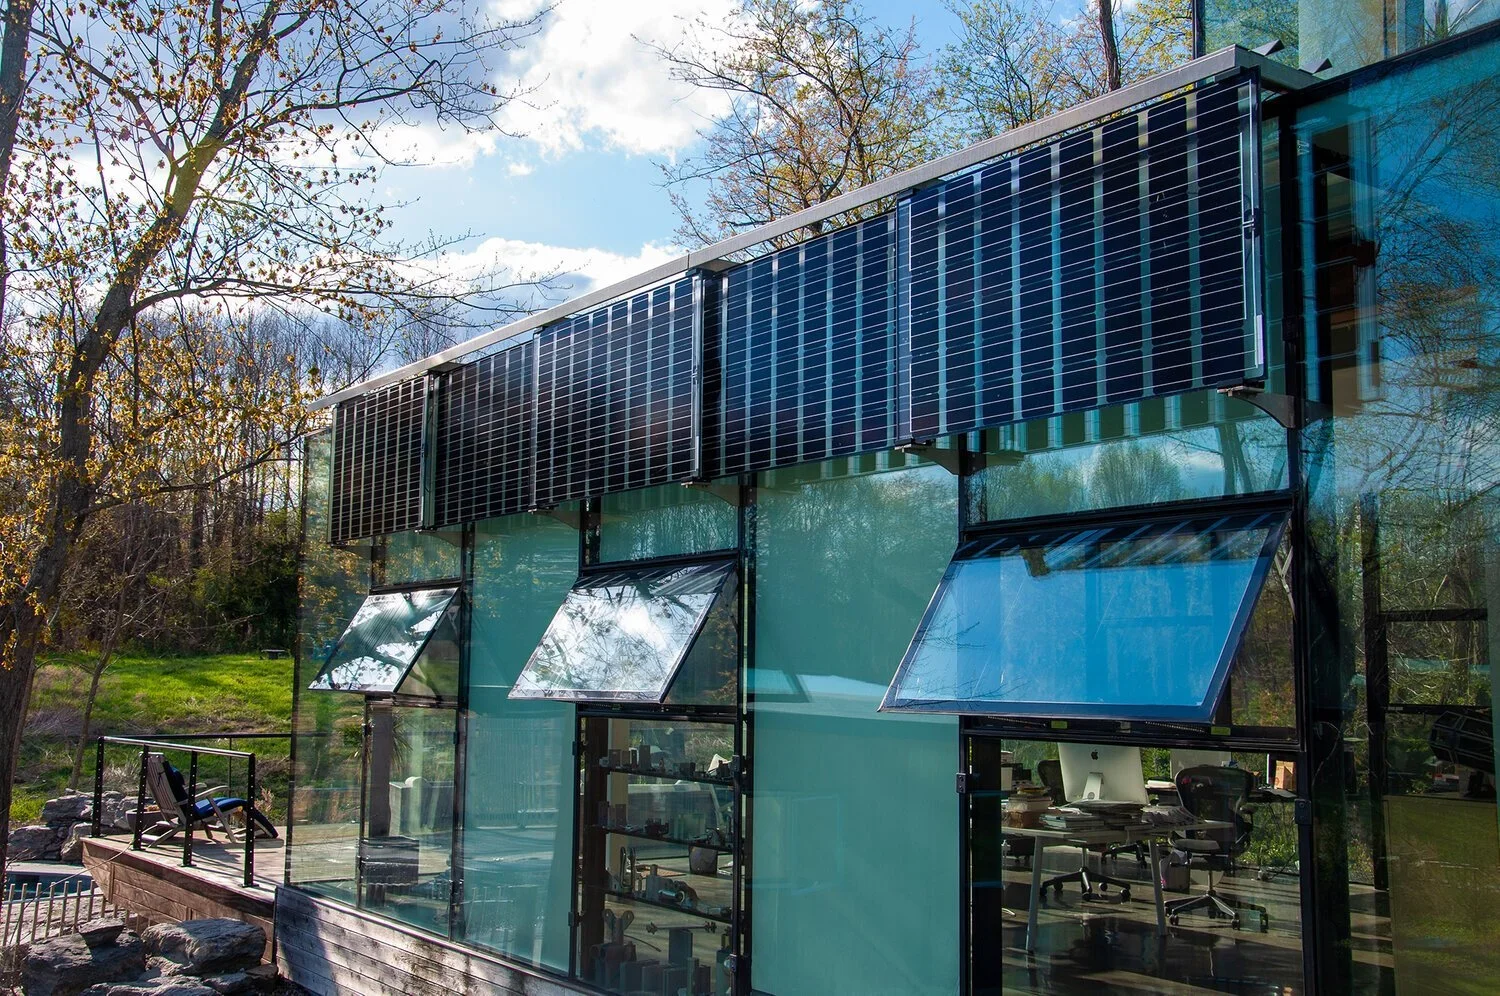
On-site green power generation is a key strategy in achieving net zero operational carbon in the built environment, as many buildings rely on on-site or off-site fossil fuel burning for heating and cooling.
With VS1, solar power can be added to a the curtain wall using simple through-the-joint support brackets. Furthermore, the solar array in these photos was added several years after the initial curtain wall installation, a powerful example of VS1’s ability to be modified and improved.

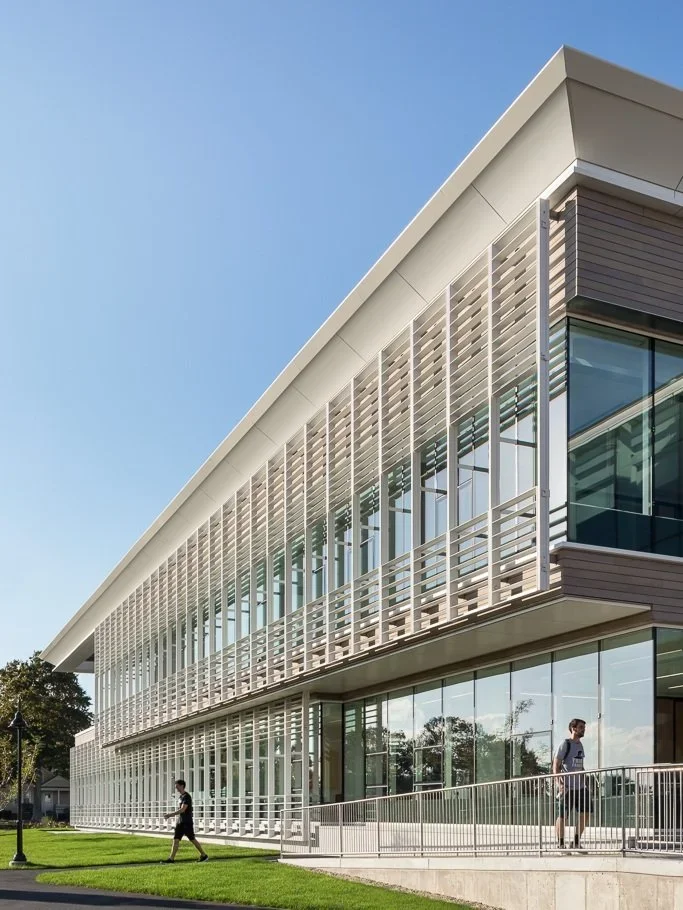
Shading technology is a simple and cost-effective method to manage a building’s solar gain. VS1 is able to integrate a variety of technologies and approaches on both the interior and exterior of the building.


Electrochromic glass, or “smart” glass, is an exciting technology that can help dynamically manage a building’s solar gain during sunlit hours. VS1 can readily accommodate both the glass panels and the associated wiring.


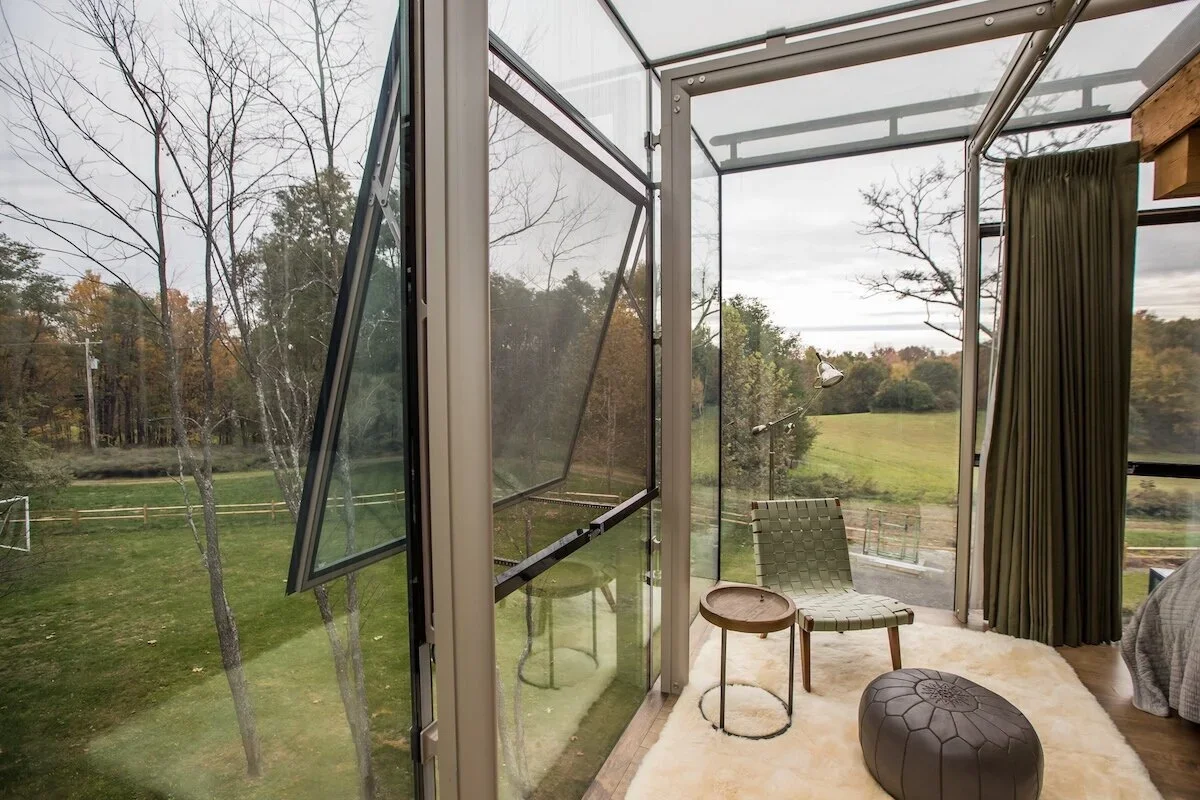
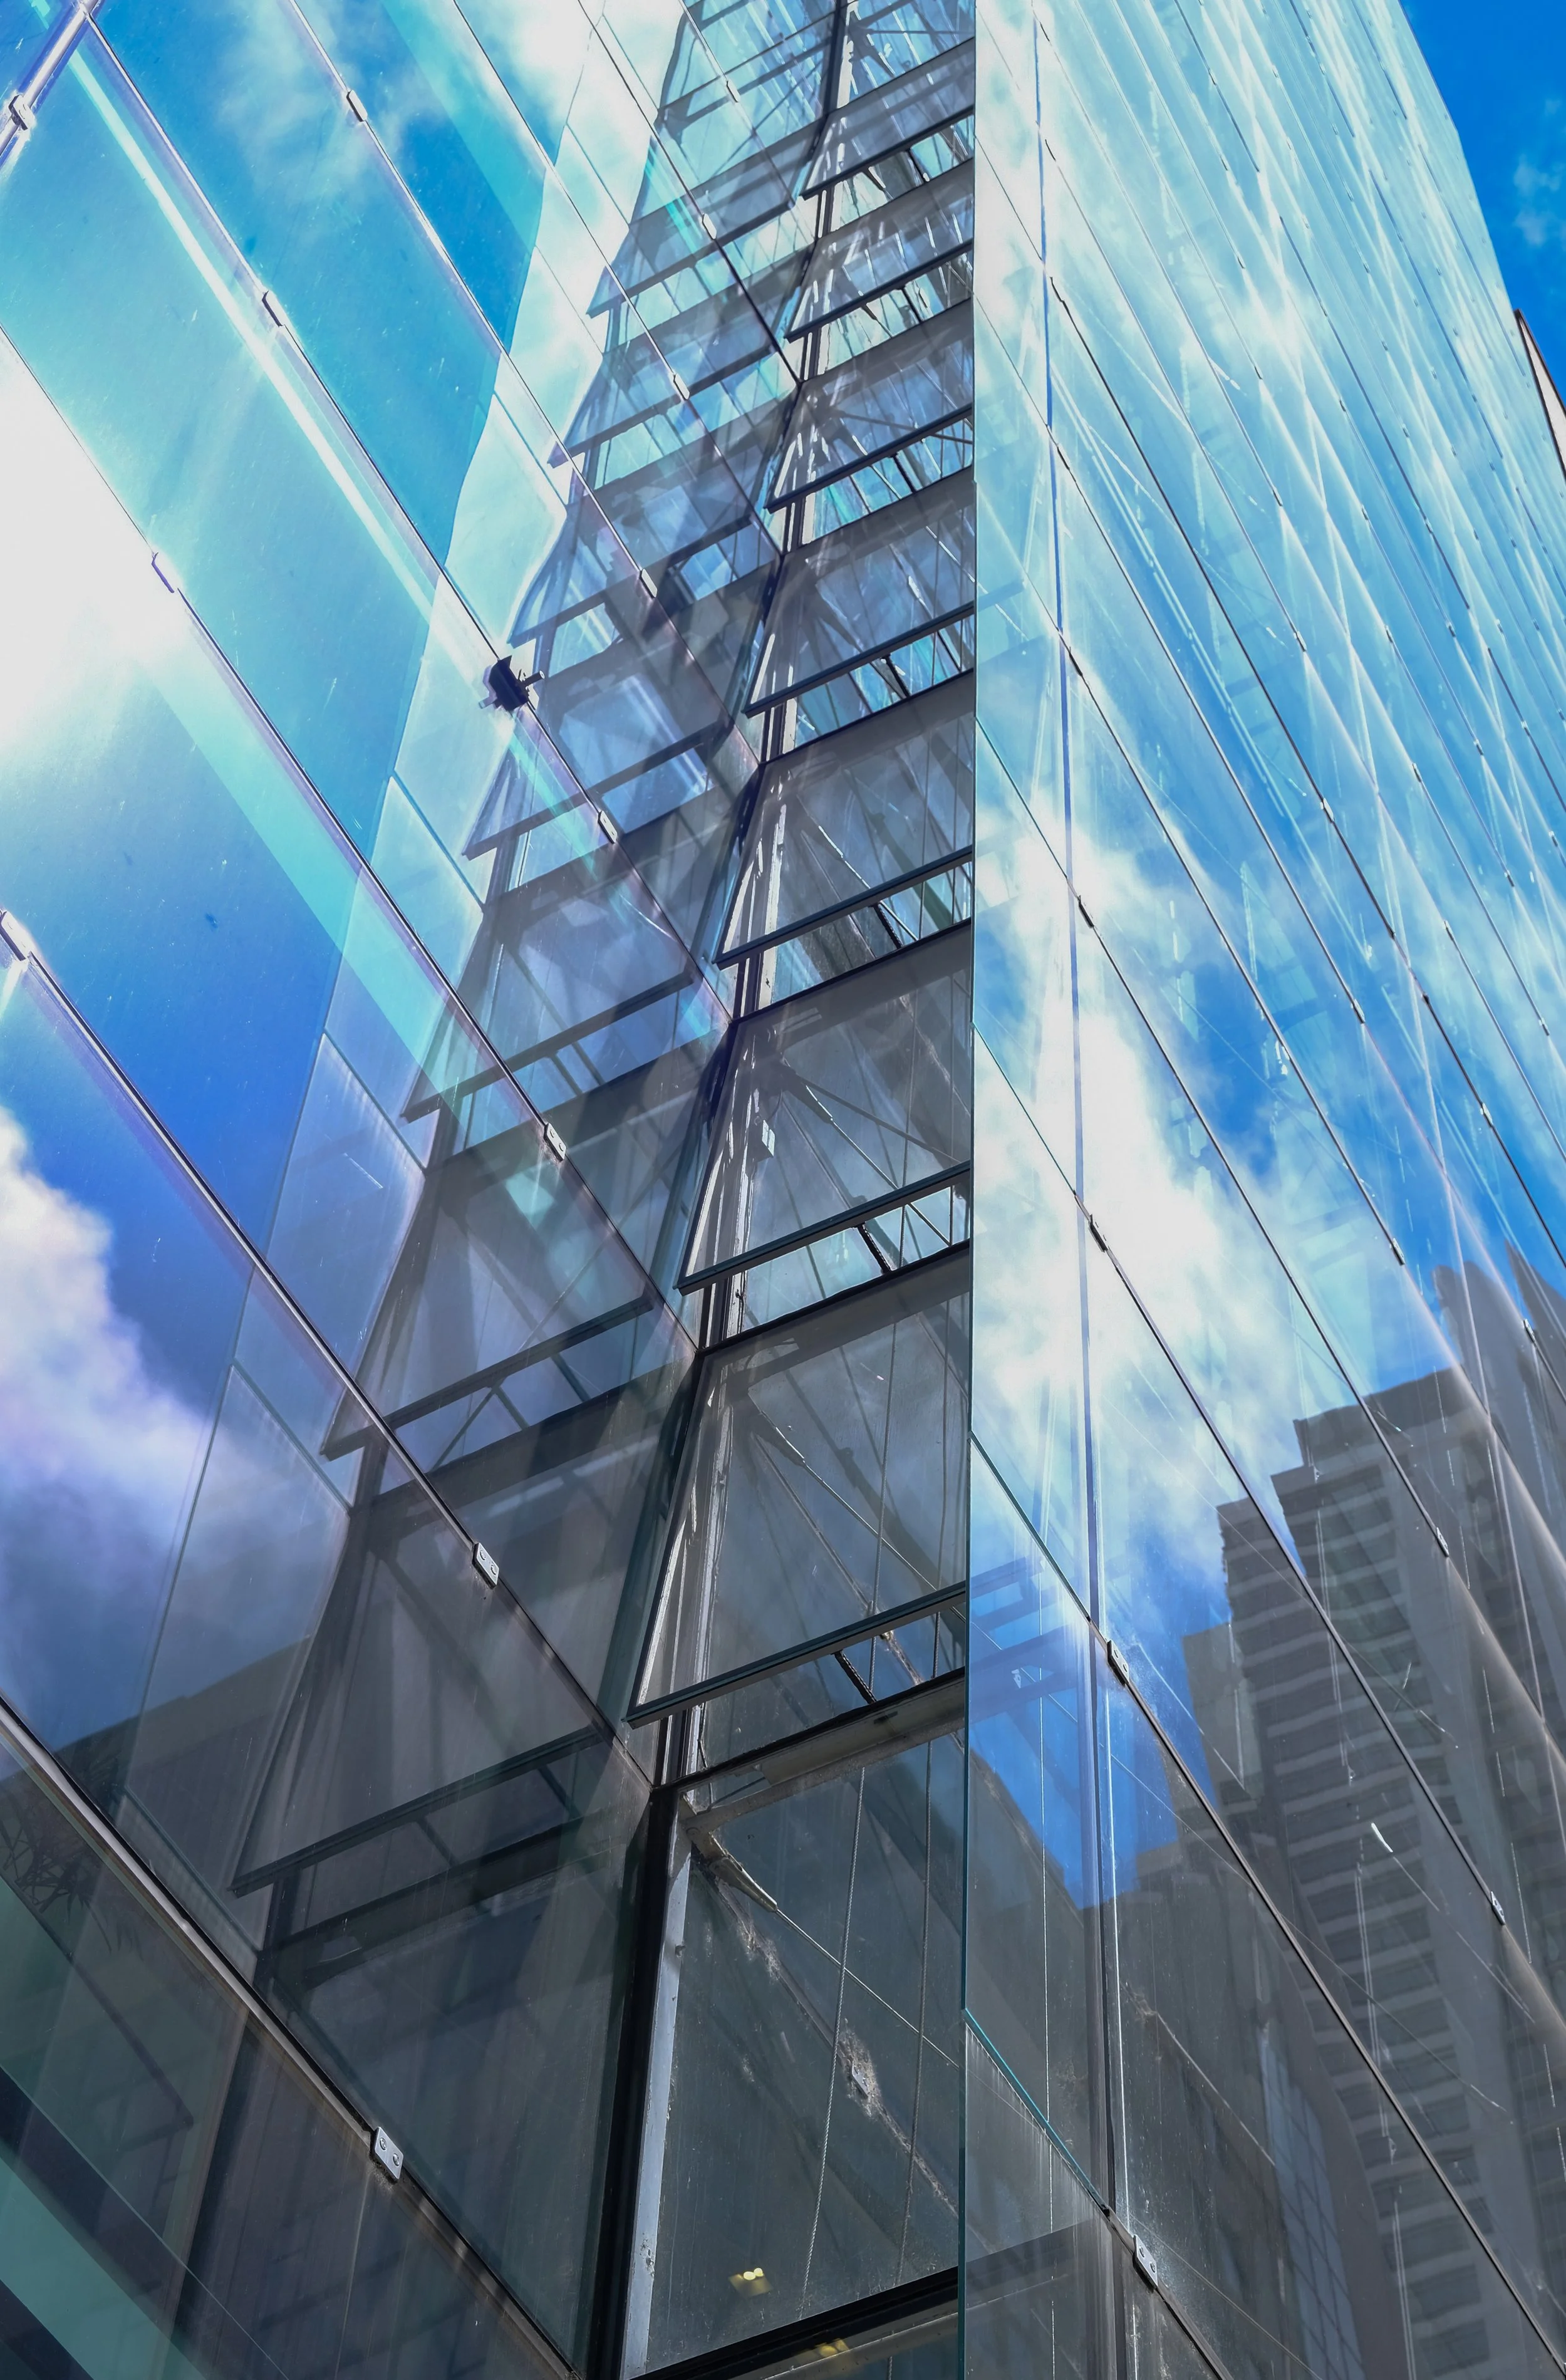
Zero sight-line, awning-style vents are a standard VS1 detail. Typically operated by small actuators, VS1 vents can be integrated into a building’s climate management system.
Read more about VS1 venting technology→

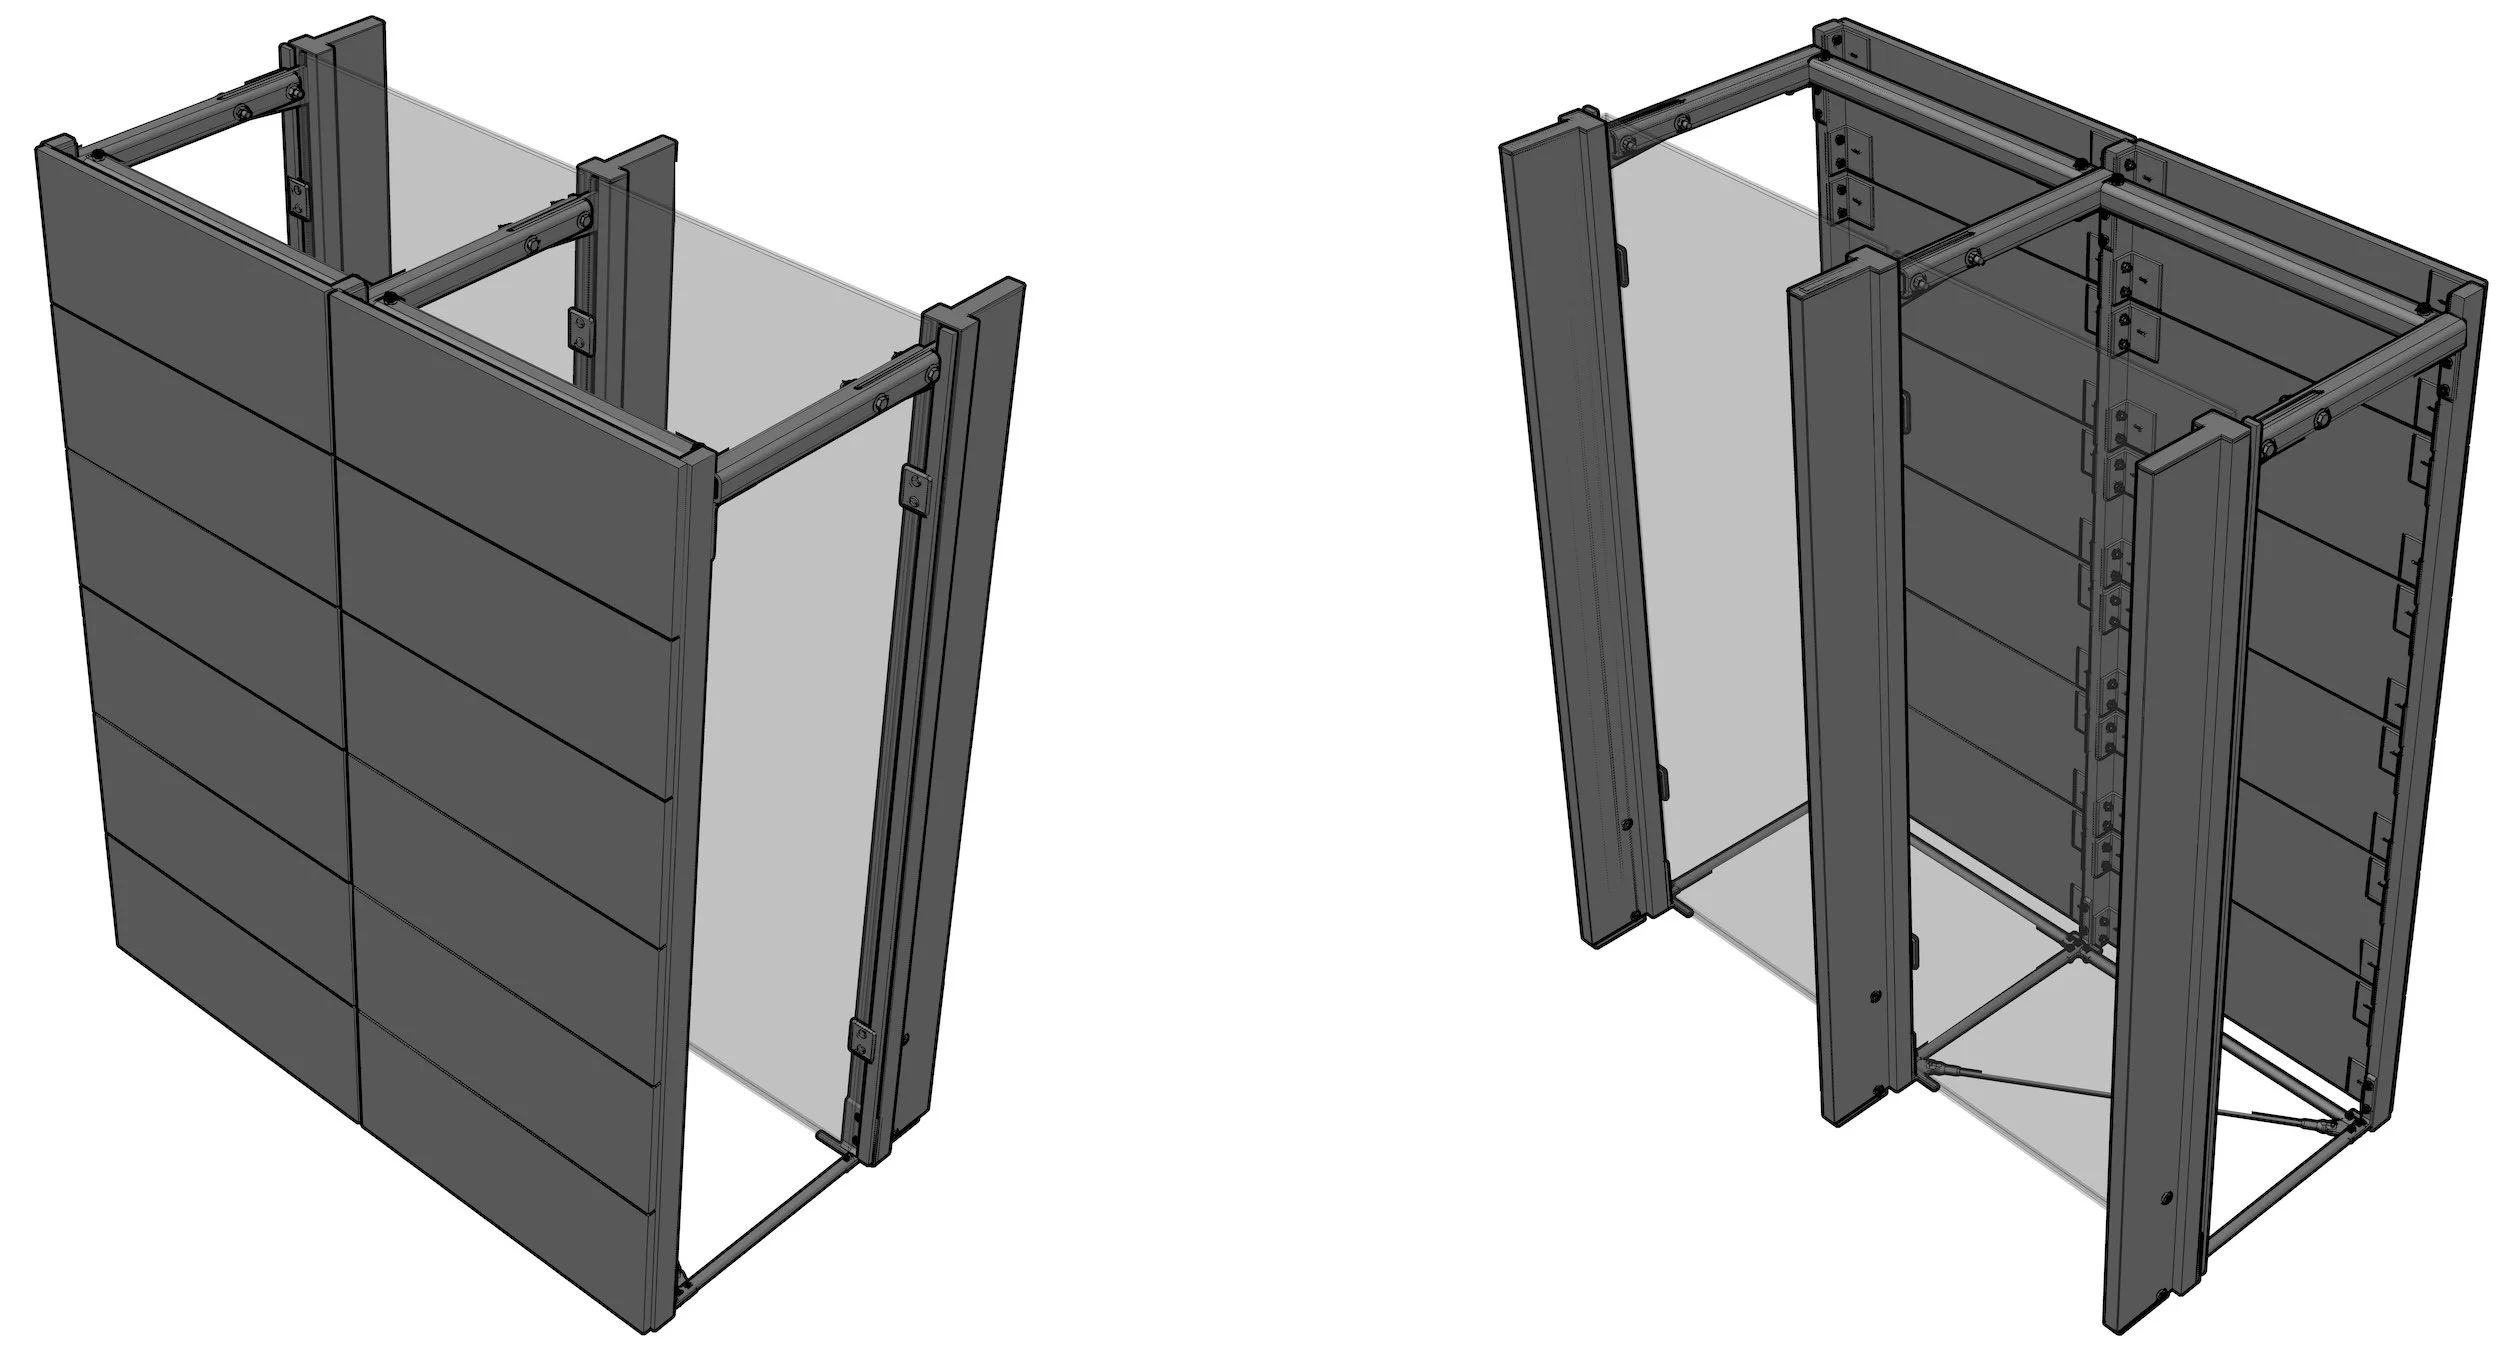
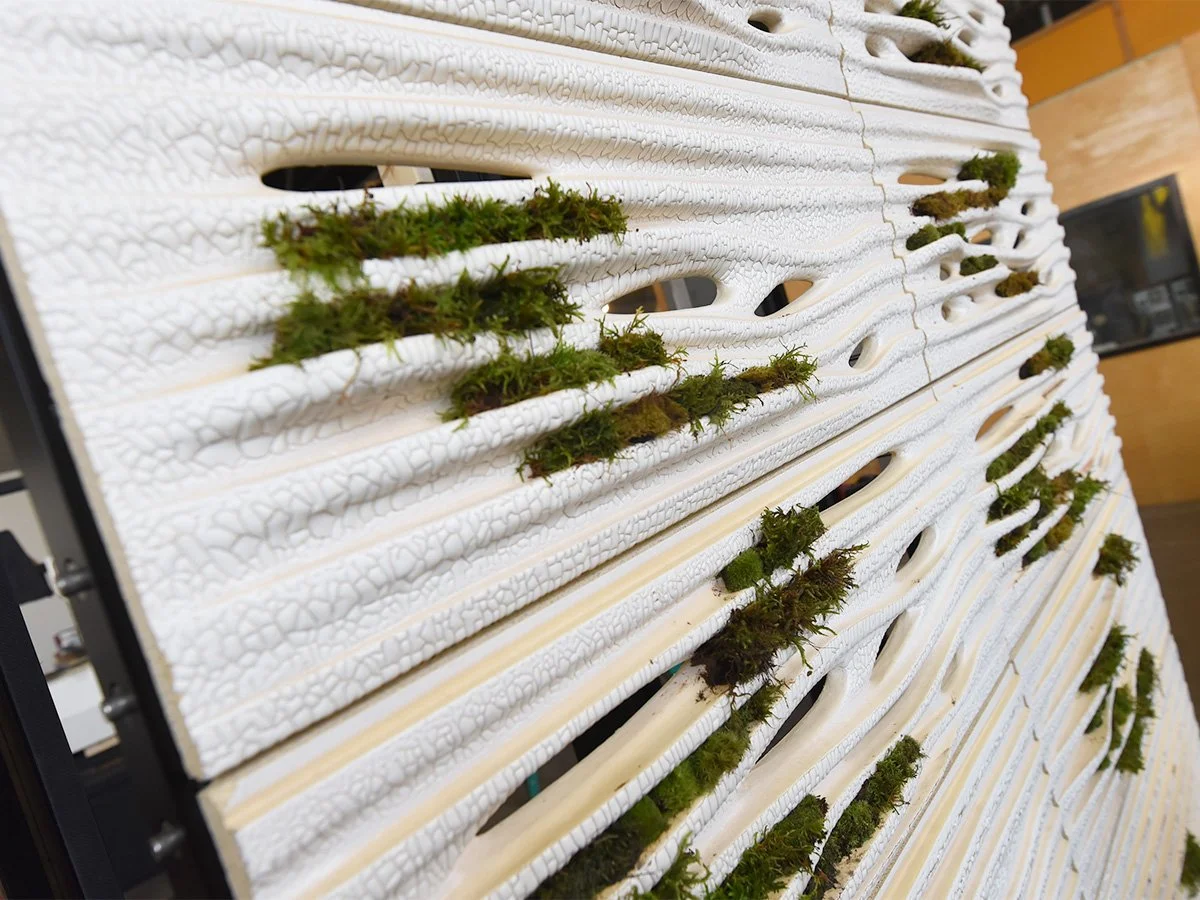
Innovation Glass, Henning Larsen, and Thornton Tomasetti collaborated at ACAW 2023 to create this terra cotta and moss green wall. Living, breathing walls like this prototype can contribute to the greening and cooling of urban spaces.
BEYOND 2050
A building constructed today will likely need the glazing replaced sometime in the 2050s, and whether the building’s long-term thermal performance is maintained or improved depends in no small part on the reglazing strategy.
With VS1, reglazing a curtain is straightforward. Whereas with a unitized system the entire wall would need to be reskinned, with VS1 the face glass can be removed (in any order) and replaced without also taking out the aluminum framing, a costly and labor-intensive process. VS1 can also accommodate more thermally efficient IGUs. (If a thicker IGU is chosen then the only modification needed is a wider gravity fitting.)
Posts 3 and 5 in this series will further explore reglazing, and how VS1 is the ideal curtain wall technology for new builds and renovations alike.
UP NEXT
The topic of embodied carbon—the footprint of the building materials and construction process, which are responsible for 15% of global CO₂ emissions—will be explored in the following posts of Cathedral Thinking. Stay tuned for more on this important topic!
SOURCES
[1] Press, The Associated. “Scientists Say August Was Earth’s Hottest Month They’ve Measured.” NPR, September 10, 2026. https://www.npr.org/2026/09/10/nx-s1-5964676/scientists-august-hottest.
Fieldhouse, Rachel, and Mohana Basu. 2026. “The World Just Lived through the 11 Hottest Years on Record — What Now?.” Nature 652 (8108): 13–14. https://doi.org/10.1038/d41586-026-00946-6.
[2] See Sources & Methodology for Figure 1
[3] “Climate Positive Design of the Exterior Built Environment – Architecture 2030.” 2023. Www.Architecture2030.Org. September 2023. https://www.architecture2030.org/climate-positive-design/.
[4] Programme, U. N. E. (2026, October 6). Air conditioning may cool the room, but it also heats the world – here are five more sustainable ways to bring down temperatures. UNEP; United Nations Environment Programme. https://www.unep.org/news-and-stories/story/air-conditioning-may-cool-room-it-also-heats-world-here-are-five-more
Figure 1
-
The left pie chart depicts global GHG emissions in carbon dioxide equivalent and a callout of the carbon dioxide portion for which building operations is responsible, and the right pie chart depicts a breakdown of the building operations emissions by end use in buildings.
This chart was compiled by Innovation Glass in an effort to better visualize the complexities of global climate change. It should not be used as an authoritative reference on total numbers, but rather a reference to approximate scope of operational and embodied carbon of the built environment in the broader context of global greenhouse gas (GHG) emissions. Emissions from the built environment are almost entirely CO₂, which is just one of four main types of GHGs. This chart scales the emissions of the built environment to their relative size by adding all emissions in CO₂ equivalent.
-
The total amount of GHG CO2 equivalent is from the Emissions Data for Global Atmospheric Research (EDGAR) using the 2024 dataset. The CO2 by source and end use percentages are derived from visuals by Architecture2030 and 2022 data from International Energy Agency.
-
Four types of gasses compose human related emissions: carbon dioxide, methane, nitrous oxide, and fluorocarbons. Methane, nitrous oxide, and fluorocarbons are all significantly more potent green house gasses than carbon dioxide, with varying atmospheric lifespans. To measure them all alongside one another, we use CO₂ equivalent, which scales a unit of methane, nitrous oxide, or fluorocarbon to its global warming potential (GWP) compared to one unit of carbon dioxide. Those GWPs are as follows: methane (CH₄), 28; nitrous oxide (N₂O), 273; and fluorinated gases vary but are generally in the thousands.
The numbers in this chart not account for emissions and sinks related to land-use change.